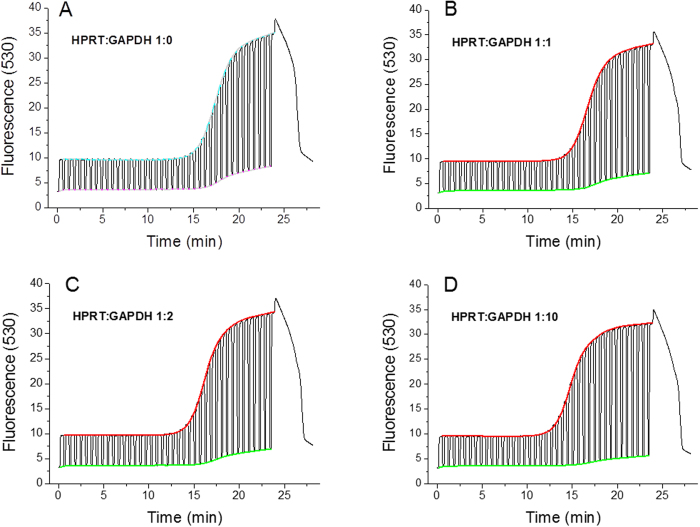
Figure 2. Raw fluorescence data from LightCycler for experiments with different ratios between HPRT and GAPDH genes.
(A) Shows HPRT gene alone, (B) ratio 1:1, (C) ratio 1:2 and (D) ratio 1:10. We extracted both denaturation (green) and extension (red) curves from all graphs. No template control (NTC) expressed no amplification and its average fluorescence amplitude was 0.113 with a standard deviation of 0.002.

