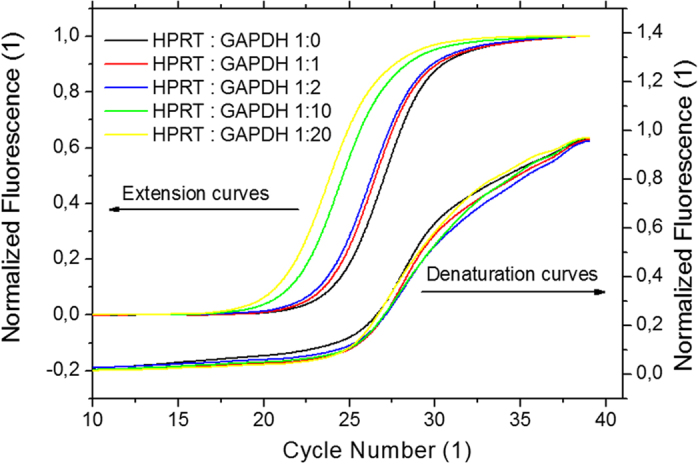
Figure 3. (left axis) Extracted normalized extension curves.

The curves’ amplitude was divided by its maximum amplitude and the slope was also subtracted for easier curve to curve comparison. (right axis) The normalized denaturation curves. The normalization was done in a similar fashion as for extension curves.
