
Fig. 1.
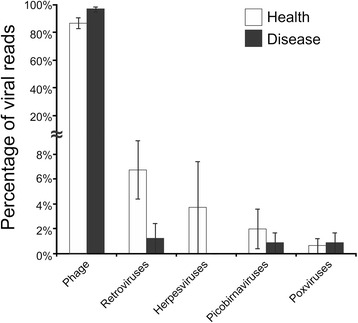
Bar chart representing the relative proportions (± standard error) of viral reads assigned to phages, retroviruses, herpesviruses, picobirnaviruses, and poxviruses. The y-axis represents the percentage of viral reads assigned to each category