Abstract
Dual energy methods can suppress the contrast between adipose and glandular tissues in the breast and therefore enhance the visibility of calcifications. In this study, a dual energy method based on analytical modeling was developed for the detection of minimum microcalcification thickness. To this aim, a modified radiographic X-ray unit was considered, in order to overcome the limited kVp range of mammographic units used in previous DE studies, combined with a high resolution CMOS sensor (pixel size of 22.5 μm) for improved resolution. Various filter materials were examined based on their K-absorption edge. Hydroxyapatite (HAp) was used to simulate microcalcifications. The contrast to noise ratio (CNRtc) of the subtracted images was calculated for both monoenergetic and polyenergetic X-ray beams. The optimum monoenergetic pair was 23/58 keV for the low and high energy, respectively, resulting in a minimum detectable microcalcification thickness of 100 μm. In the polyenergetic X-ray study, the optimal spectral combination was 40/70 kVp filtered with 100 μm cadmium and 1000 μm copper, respectively. In this case, the minimum detectable microcalcification thickness was 150 μm. The proposed dual energy method provides improved microcalcification detectability in breast imaging with mean glandular dose values within acceptable levels.
1. Introduction
Breast cancer is one of the most common causes of cancer death in the United States [1]. Diagnosis of this type of cancer in its early stage makes the treatment more effective [2–4]. Several imaging modalities, such as mammography, ultrasound, and digital tomosynthesis, have been used in diagnosing breast cancer. X-ray mammography is the gold standard method for early detection of breast carcinomas [5–8]. One of the principal indicators of breast cancer is microcalcifications (μCs). Although they are small in size (0.1–1 mm), their X-ray attenuation is higher than the surrounding breast tissue, making them visible. However, overlapping tissue structures make them very difficult to detect [9]. Dual energy (DE) X-ray imaging can suppress the contrast between adipose and glandular tissues improving the detectability of microcalcificat ions (μCs) [10, 11]. With this technique, images that are acquired with two different X-ray spectra are subtracted, resulting in an image with enhanced microcalcification information [12].
Several dual energy techniques have been evaluated for mammography [13, 14]. These studies showed that the minimum calcification thickness was 250 μm or higher when mammographic X-ray units were used [13, 14]. Previous simulation study has shown that improved calcification detectability can be achieved by using higher energies than those in the mammographic range [10]. Furthermore, detectors such as charged coupled detectors (CCD) and complementary metal oxide semiconductor (CMOS) active pixel sensors (APS), with an effective pixel size smaller than that of current flat panel imagers (70–100 μm), can improve the detection and characterization of microcalcifications [15–17].
To this aim, a dual energy method for the detection of the minimum microcalcification thickness was investigated, incorporating a modified radiographic X-ray unit, in order to overcome the limited kVp range of mammographic units, combined with a high resolution CMOS sensor (pixel size of 22.5 μm) for improved resolution. The pair of energies providing the minimum detectable microcalcification thickness was determined through monoenergetic analytical modeling. Afterwards, the optimum irradiation conditions (X-ray tube high voltage, filter material according to their K-edge and thickness) were determined for polyenergetic spectra. The calcification contrast to noise ratio of the subtracted images (CNRtc) was calculated for various skin entrance doses. The DE method modeled in this study provides improved calcification detectability in breast imaging.
2. Materials and Methods
In order to determine the minimum detectable calcification thickness, a previously presented theoretical framework [13] was used for the numerical calculation of contrast to noise ratio corresponding to the subtracted calcification image. Simulation studies were developed based on monoenergetic and polyenergetic X-ray beams. Various parameters were examined, that is, X-ray filtration, entrance surface, and mean glandular doses. The methods for these computations are described in the following sections.
2.1. Monoenergetic X-Ray Beams
An investigation based on simulation studies was employed in order to determine the optimal pair of energies, that is, the low and high X-ray energy, required for the DE technique. Initially monochromatic X-ray beams were considered with energies in the range between 15 and 90 keV, at 1 keV increments. Within this investigation, an analytical model was developed in order to determine the CNRtc corresponding to a calcification (C). In this model, the pair of energies maximizing the CNRtc were estimated for calcifications of various thicknesses under the following assumptions: (i) X-ray photons follow a Poisson distribution [13] and (ii) the CNRtc threshold value for detection of a calcification is equal to 3 [13].
In the present investigation, it was considered that the breast consists of adipose tissue of thickness t a, glandular tissue of thickness t g, and a cubic calcification of thickness t c. Under this consideration, the signals in the low- and high-energy images, S l and S h, were expressed as follows [13]:
| (1) |
where R j is the unattenuated low-/high-energy X-ray exposure at the detector input (mR), d is the pixel size in centimeters (mm), Φj(E i) is the unattenuated low- and high-energy photon fluence per unit of energy and exposure (photons/mm2 keV mR) at the detector input, QDE(E i) is the quantum detection efficiency of the phosphor screen as a function of photon energy E, and A s is the spectral compatibility between the optical spectrum of the phosphor and the sensitivity of the optical photon sensor. The energy-dependent mass attenuation coefficients for adipose tissue, glandular tissue, and calcifications are given by μ/ρ a(E i), μ/ρ g(E i), and μ/ρ c(E i), respectively.
Then, the signal-to-noise ratio in the low- and high-energy image signals SNRSj can be calculated by [13]
| (2) |
where ΔM g(E i) = ((μ/ρ)g(E i)ρ g − (μ/ρ)a(E i)ρ a) and ΔM c(E i) = ((μ/ρ)c(E i)ρ c − (μ/ρ)a(E i)ρ a).
The noise variance in the subtracted calcification image signal is given by [13]
| (3) |
where
| (4) |
Therefore, the SNR of the subtracted calcification signal can be expressed as follows [13]:
| (5) |
In the final image, the adipose tissue structures are cancelled out resulting in an almost zero background value. Thus, the SNR of the microcalcification signal in the subtracted image is equal to the CNR [13]. In the rest of this work, we will refer to calculations performed using (5) as the calcification CNR (CNRtc).
The CNRtc has been evaluated for the subtracted digital images of 4 cm thick compressed breast, with composition of 50% glandular and 50% adipose tissue. The calcifications examined were 100 to 500 μm thick in 50 μm increments. Hydroxyapatite (HAp), described chemically as Ca5(PO4)3(OH), was considered as the calcification material [18]. The used detection system consisted of a terbium-doped gadolinium oxysulfide (Gd2O2S:Tb) phosphor screen (Min-R 2190 with mass thickness of 33.91 mg/cm2) coupled to an optical readout device including a CMOS Remote RadEye HR photodiode pixel array [19]. The CMOS photodiode array has a format of 1200 × 1600 pixels, corresponding to an active area of 27 × 36 mm2, with a pixel pitch of 22.5 μm [20]. This scintillator was selected due to its high efficiency and imaging properties [21]. The quantum detection efficiency, QDE(E i), and the matching factor, A s, were calculated according to previous studies [20, 21].
The elemental compositions (weight fractions) of the adipose and glandular tissue [22] are shown in Table 1, while for the calcifications and the scintillator materials the corresponding values were calculated by their chemical formula. Based on these data, the mass attenuation coefficients (μ/ρ) were determined using data published by NISTIR (National Institute of Standards and Technology Interagency Report) [23]. The density values of the above materials are shown in Table 2 [13, 18, 22].
Table 1.
Elemental composition (weight fractions) of breast phantom materials.
| Materials | Elemental composition (weight fraction) | |||
|---|---|---|---|---|
| H | C | N | O | |
| Adipose tissue | 11.2 | 61.9 | 1.7 | 25.1 |
| Glandular tissue | 10.2 | 18.4 | 3.2 | 67.7 |
Table 2.
Density values for the materials used in the calculations.
| Materials | Density (g/cm3) |
|---|---|
| Ca5(PO4)3(OH) | 3.18 |
| Gd2O2S:Tb | 7.34 |
| Adipose tissue | 0.93 |
| Glandular tissue | 1.04 |
Following mammography regulations, the total skin entrance dose used in the monoenergetic study was 6 mGy [24]. The optimal distribution of the skin entrance dose between the low- and high-energy images was studied by calculating the CNRtc in the subtraction image signals as a function of the “low-energy dose ratio,” LDR. The LDR was defined as the ratio of the low-energy dose to the total dose. The optimal dose ratio was determined as the ratio at which CNRtc value was maximized.
Since monoenergetic beams cannot be obtained in clinical practice, an approach to monoenergetic beams was employed using polyenergetic X-ray spectra under K-edge filtration [25, 26].
2.2. Polyenergetic X-Ray Beams
In the polyenergetic simulation study, the low- and high-energy signals can be calculated by integrating over the energy range in (1) as follows:
| (6) |
For the implementation of the method using polyenergetic spectra, the mass attenuation coefficients were replaced by effective mass attenuation coefficients in (2) and (3).
Unfiltered spectra were obtained from TASMIP spectral models generated for tungsten (W) anode, for both low energy and high energy [27]. The peak tube voltages were 40 kVp for the low energy (LE), which is the minimum tube voltage available in the radiographic system, and 70 kVp for the high energy (HE).
For the determination of the dose value at which the detector saturates, the detector response curve was measured. Thus, a breast phantom of polymethyl methacrylate (PMMA) and polyethylene (PE) with total thickness of 4 cm [28] was positioned at 62 cm (source to object distance, SOD) from the tube exit of the Del Medical Eureka radiographic system [29] and exposed using tube voltages of 40 kVp and 70 kVp for the low and high energy, respectively. An ionization chamber (Radcal 2026C) was positioned at the surface of the breast phantom. The entrance surface air kerma was measured for a range of tube current-time products. The source to detector distance (SDD) was 66 cm. Both LE and HE images were saved as raw data and 100 × 100 pixels' square regions of interest (ROIs) were measured from each image. The mean pixel value (MPV) and the standard deviation within that region were measured and the relationship between MPV and the detector entrance dose was determined using linear regression. As indicated by the detector response curve of the RadEye HR CMOS sensor, for high-energy spectra, the detector was saturated for doses above 0.42 mGy. For the low energy, the maximum dose value was restricted by the radiographic system performance to 0.37 mGy. Thus, the corresponding unfiltered surface doses that are used in this simulation for the high and low energy were 36.99 and 11.31 mGy, respectively. Additional lower doses were examined by reducing the tube current-time product (mAs).
In order to obtain spectra with mean energies similar to those indicated by the monoenergetic study, various filters based on their K-absorption edge were applied to the beams (K-edge filtering) [26]. In the low-energy beam, three different filter materials were applied: palladium (Pd), silver (Ag), and cadmium (Cd) with K-edges ranging from 24 to 26 keV. For the high-energy beam, five filter materials were applied: copper (Cu), europium (Eu), neodymium (Nd), samarium (Sm), and holmium (Ho). Copper is a low cost filter material commonly used for beam filtration in X-ray systems attenuating low energies in spectra. The other filters used for the HE were rare earth metals with K-edge energies ranging from 43 to 56 keV. The filter thicknesses varied from 10 to 150 μm and 100 to 1500 μm for the low and high energy, respectively. K-edge filtering technique is used, since it produces narrower energy bands of the X-ray spectra leading to an increase of spectral separation [13, 26]. Previous calculations have shown that image noise decreases with greater separation between the low- and high-energy spectra [13]. The breast composition and the detector system used were similar to the monoenergetic study. Figure 1 shows a schematic representation used for the low and high irradiations of the breast phantom.
Figure 1.
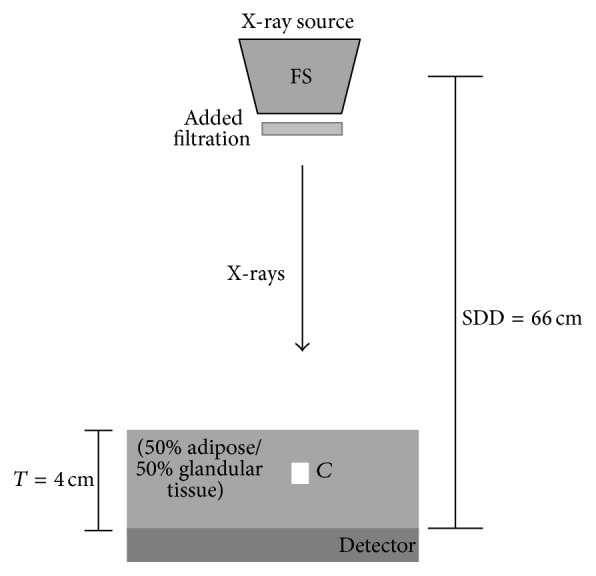
Schematic representation of the simulated set-up.
The air kerma at the entrance of the breast, after filtration of the X-ray beams, was calculated according to [30]
| (7) |
where Φ(E i) is the filtered X-ray spectrum (photons/mm2) at energy E. (μ en(E i)/ρ)air is the X-ray mass energy absorption coefficient of air at energy E obtained from the literature [23].
Mean glandular dose (MGD) was calculated for various skin entrance doses, considered in this study using [31]
| (8) |
where DgN is a numerical factor [32] and K a is the skin entrance dose defined in (7). MGD was calculated for the low- and the high-energy exposure and then summed to obtain the total mean glandular dose. DgN data for a breast thickness of 4 cm, with 0% and 100% glandularity, were obtained from published data [32]. Then, DgN values were fitted with a modified Fermi-Dirac distribution function for the 0% and 100% glandular tissues, as follows:
| (9) |
where a = 23.929, b = 7.5601, c = 1279.2, and d = 151 for 0% glandular tissue and a = 20.890, b = 6.4476, c = 1185.6, and d = 179 for 100% glandular tissue. For 50% glandular tissue, the mean MGD value was used.
For all filtered spectra, relative Root Mean Square Error (RMSErel) was calculated as an indicative parameter of spectral energy bandwidth. The RMSErel calculates the divergence between each energy value of the spectrum from the corresponding mean energy [26]. RMSErel can be expressed as
| (10) |
where Φ(Ei) are the photons/mm2 at each energy, E i is the energy (keV), and is the mean energy of the spectrum (keV).
3. Results and Discussion
3.1. Monoenergetic Beams
The optimum pair of beam energies was selected by applying the criterion of CNRtc maximization. The difference between the low energy and high energy that maximizes the CNR values was found in the range of 25 to 40 keV. The optimum pair of beam energies was 23 keV and 58 keV for the low and high energy, respectively. Previous calculations with an ideal detector and monoenergetic X-rays predict that 19 keV and 68 keV are the optimal low and high energies for dual energy imaging [10]. Differences in the optimum low-/high-energy pair can be explained on the basis of the detector performance.
In Figure 2, CNRtc values are plotted as a function of LDR for all the examined calcification thicknesses. The range of the optimum LDR values, which was defined as the range corresponding to CNRtc within the 30% of its maximum, was determined for all the C thicknesses considered in the present study. The optimum LDR for 100, 300, and 500 μm calcification thickness ranged from 0.20 to 0.65, 0.20 to 0.66, and 0.20 to 0.66, respectively. Based on the overlap of these ranges, an LDR between 0.20 and 0.65 was considered for all thicknesses. For the minimum examined calcification thickness of 100 μm, a CNRtc value of 11.57 can be achieved for the optimum LDR.
Figure 2.
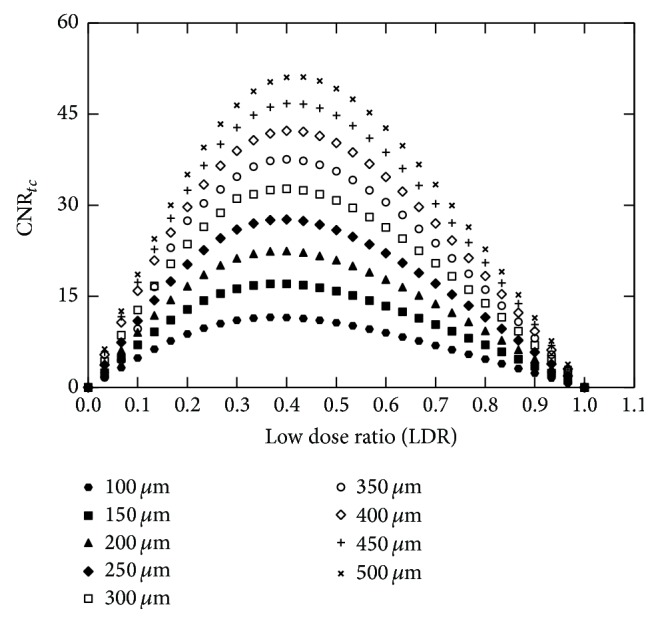
Plots of CNRtc as a function of the low dose ratio for all the examined calcification thicknesses.
3.2. Polyenergetic X-Ray Spectra
Figures 3(a) and 3(b) show the detector response curves for both the low- and the high-energy beams, respectively. The detector had linear response in the whole exposure range, for the low-energy beam. However, for the high-energy beam, the response of the detector was linear up to 0.42 mGy. Above this value, the detector was saturated. The linear regression correlation coefficient (R 2) was greater than 0.9990 for the LE beam and 0.9992 for the HE beam.
Figure 3.
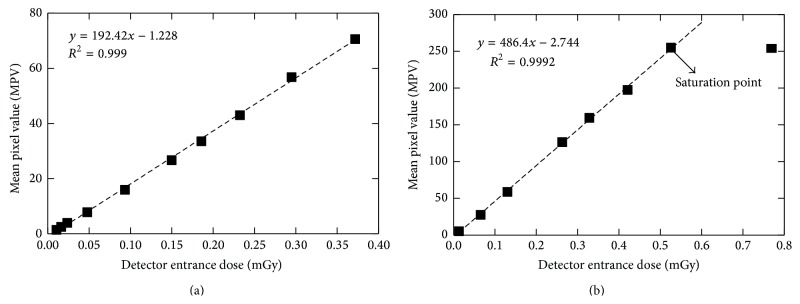
Plot of mean pixel value as a function of the detector entrance dose for the low-energy beam (a) and the high-energy beam (b). The point at the right in (b) was ignored in the linear regression, since it was above the saturation point.
Figure 4 shows the RMSErel curve for all the filter materials examined for the LE, as a function of surface density (g/cm2). It is obvious that Cd is the optimum filter material, as it minimizes the RMSErel over the whole surface density range.
Figure 4.
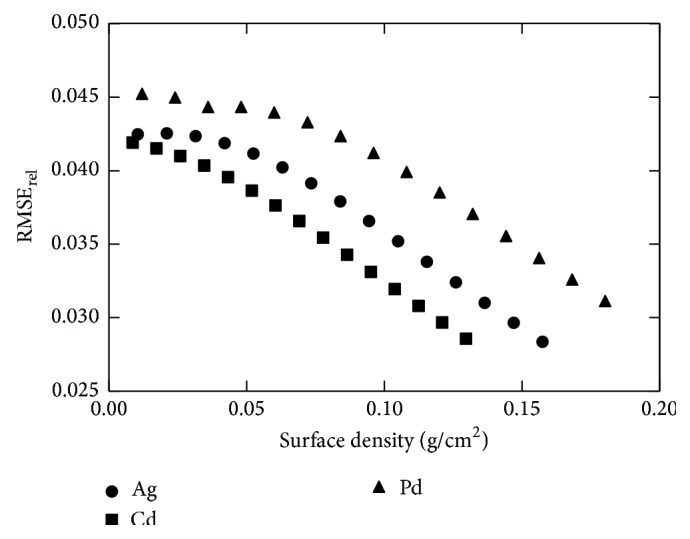
Plots of RMSErel as a function of surface density (g/cm2) for all low-energy filter materials.
Figure 5 shows the RMSErel and the coefficient of variation of the incident number of photons per mm2 (Φ(E)) at the detector's surface (CVΦ(E), where ). The two curves intersect at a point where the RMSErel is equal to CVΦ(E). This point (surface density of 0.086 g/cm2) was selected as the optimum filter thickness, corresponding to 100 μm.
Figure 5.
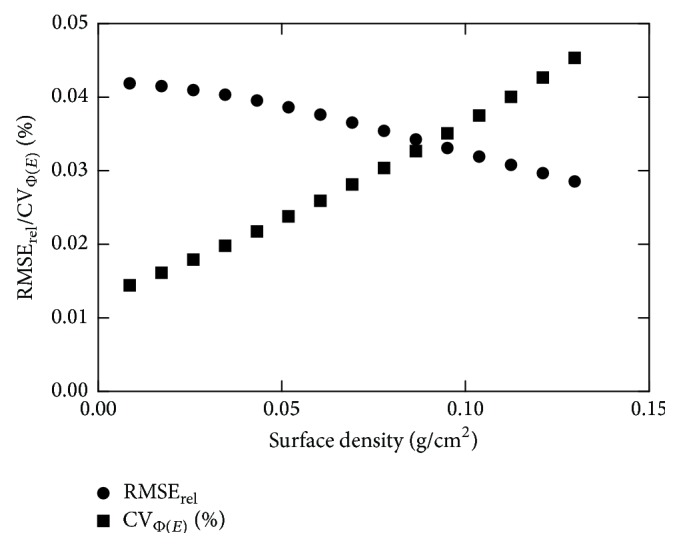
Plots of RMSErel and CVΦ(E) as a function of surface density (g/cm2) for Cd.
Figure 6 shows the CNRtc as a function of surface density (g/cm2) for all the HE filters (Cu, Eu, Nd, Sm, and Ho), combined with a Cd filter with a thickness of 100 μm. Copper was selected as the HE filter due to its higher CNRtc values compared to the other filter materials.
Figure 6.
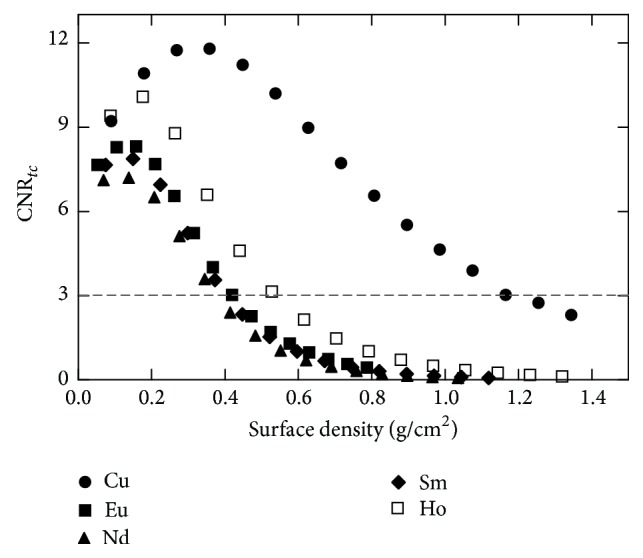
CNRtc values as a function of surface density (g/cm2) for all high-energy filters, combined with 100 μm Cd (LE filter).
In Figure 7, entrance dose and CNRtc are plotted against the surface densities of Cu. For surface densities between 0.896 and 1.075 g/cm2, the differences in entrance dose and CNRtc were on average 6.63% (7.33%, 5.94%) and 15.95% (15.90%, 16.00%), respectively. Thus, a Cu filter with surface density of 0.896 g/cm2 was selected, due to its compromise between entrance dose and CNRtc. In this thickness, a CNRtc of 5.52 (above the threshold, CNRtc > 3) can be achieved for a calcification thickness of 150 μm with an entrance dose of 3.52 mGy. When the selected filters of Cd and Cu of 100 μm and 1000 μm were used, the mean energies for the low- and high-energy spectra were 26 keV and 55 keV, respectively.
Figure 7.
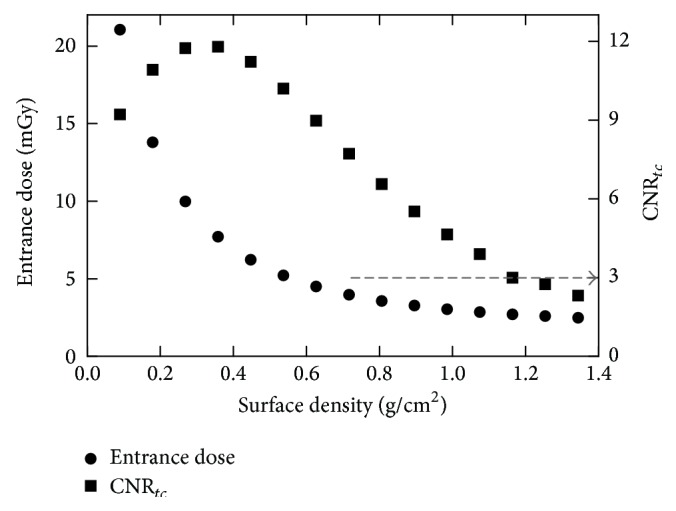
Entrance dose and CNRtc values as functions of surface density (g/cm2) of Cu (HE filter).
After filters selection, the CNRtc values for all the calcification thicknesses were calculated for different LE and HE entrance surface doses. Table 3 shows the unfiltered and filtered entrance doses as well as the corresponding LDR values. Entrance dose values and calculated MGD values for 50% glandular tissue are reported in Table 4. Although the screening examination MGD levels for dual energy applications have not yet been established, the MGD levels considered in the present study are those of mammography [33]. In previous dual energy breast imaging studies, the MGD ranged from 1.55 to 2.87 mGy [11, 13, 14]. In this study, the maximum MGD value for 50% glandularity was 2.70 mGy, which is comparable to previous studies and falls within the acceptable levels (MGD < 3 mGy).
Table 3.
Unfiltered and filtered entrance surface doses (ESD).
| Unfiltered ESD (mGy) | Filtered ESD (mGy) | |||||
|---|---|---|---|---|---|---|
| LE | HE | Total | LE | HE | Total | LDR |
| 11.31 | 36.99 | 48.31 | 2.28 | 1.24 | 3.52 | 0.64 |
| 5.65 | 36.99 | 42.64 | 1.14 | 1.24 | 2.38 | 0.47 |
| 2.83 | 36.99 | 39.82 | 0.57 | 1.24 | 1.81 | 0.31 |
| 11.31 | 23.12 | 34.43 | 2.28 | 0.78 | 3.06 | 0.75 |
| 5.65 | 23.12 | 28.77 | 1.14 | 0.78 | 1.92 | 0.59 |
| 2.83 | 23.12 | 25.95 | 0.57 | 0.78 | 1.35 | 0.42 |
| 2.83 | 11.56 | 14.39 | 0.57 | 0.39 | 0.96 | 0.59 |
Table 4.
Entrance surface dose (ESD) values and MGD for 50% glandularity.
| Low energy | High energy | ||
|---|---|---|---|
| ESD (mGy) | MGD (mGy) | ESD (mGy) | MGD (mGy) |
| 2.28 | 1.27 | 1.24 | 1.43 |
| 1.14 | 0.62 | 0.78 | 1.00 |
| 0.57 | 0.30 | 0.39 | 0.50 |
In Figure 8, CNRtc is plotted versus calcification thickness for all total surface doses examined. The higher CNRtc values were obtained from the maximum settings (3.52 mGy) for all C thicknesses. The minimum detectable C thickness was 150 μm, while in previous simulation studies it was 250 μm or higher. When the lower dose was used, the CNRtc was found above the threshold when the calcification thickness was 250 μm or higher. Higher doses are expected to have higher CNRtc values due to better counting statistics. An inversion between 3.06 and 2.38 mGy curves was observed. This can be attributed to the LDR that affects the calculation of the CNRtc (see Figure 2). For the 3.06 mGy, the LDR was 0.75, which is above the optimum LDR range defined to be within the 30% of the maximum CNRtc value.
Figure 8.
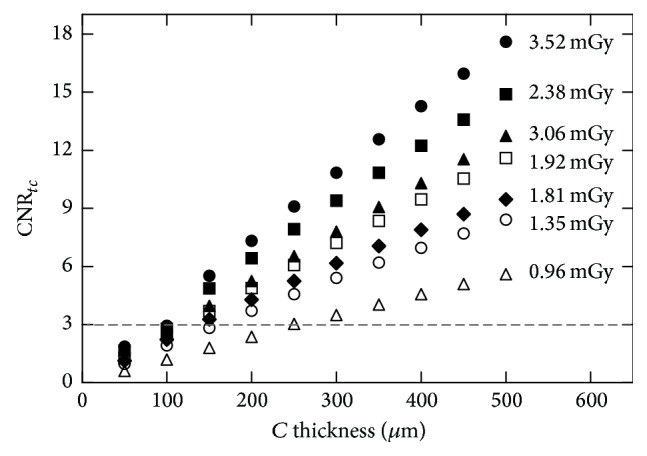
CNRtc values as a function of calcification thickness (μm) for various entrance doses.
Furthermore, preliminary experimental measurements were carried out using a homogenous phantom. Figure 9 shows the dual energy subtracted image for a calcification thickness of 300 μm and dose at the entrance of the breast phantom equal to 3.52 mGy. The image was obtained by using 100 μm Cd filter at 40 kVp and 1000 μm Cu filter at 70 kVp. Extended phantom measurements will be held in future studies in order to evaluate the proposed method.
Figure 9.
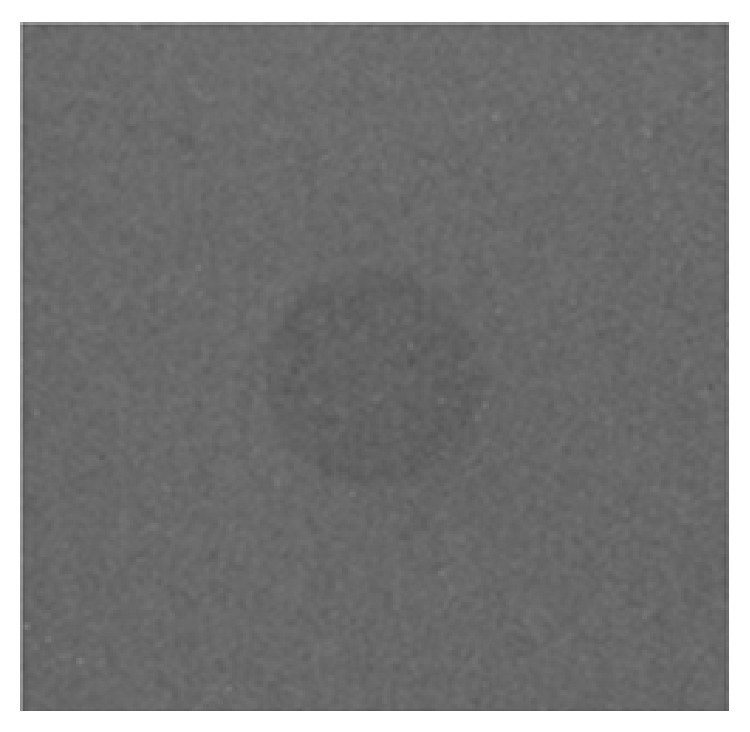
Dual energy subtracted image showing a calcification thickness of 300 μm.
4. Conclusions
A simulation study, based on analytical modeling, was performed in order to obtain the optimized irradiation parameters for the detection of the minimum calcification thickness. To this aim, a modified radiographic X-ray unit was considered, in order to overcome the limited kVp range of mammographic units used in previous DE studies, combined with a high resolution CMOS sensor (pixel size of 22.5 μm) for improved resolution. Contrast to noise ratio of the subtracted calcification images was calculated. Various filter materials, based on their K-edge, were examined in order to obtain narrow X-ray spectra. The minimum detectable (CNR > 3) calcification thickness, using monoenergetic beams, was 100 μm, while for polyenergetic X-rays it was 150 μm. The results showed that this method could improve detectability of microcalcifications in breast imaging.
Acknowledgments
This research has been cofunded by the European Union (European Social Fund) and Greek National Resources under the framework of the “Archimedes III: Funding of Research Groups in TEI of Athens” project of the “Education & Lifelong Learning” Operational Programme.
Conflict of Interests
The authors declare that there is no conflict of interests regarding the publication of this paper.
References
- 1.Siegel R., Naishadham D., Jemal A. Cancer statistics, 2012. CA: A Cancer Journal for Clinicians. 2012;62(1):10–29. doi: 10.3322/caac.20138. [DOI] [PubMed] [Google Scholar]
- 2.American Cancer Society. Breast Cancer Facts and Figures 2011-2012. Atlanta, Ga, USA: American Cancer Society; 2011. [Google Scholar]
- 3.Seyyedi S., Cengiz K., Kamasak M., Yildirim I. An object-oriented simulator for 3D digital breast tomosynthesis imaging system. Computational and Mathematical Methods in Medicine. 2013;2013:8. doi: 10.1155/2013/250689.250689 [DOI] [PMC free article] [PubMed] [Google Scholar]
- 4.Mert A., Kılıç N., Bilgili E., Akan A. Breast cancer detection with reduced feature set. Computational and Mathematical Methods in Medicine. 2015;2015:11. doi: 10.1155/2015/265138.265138 [DOI] [PMC free article] [PubMed] [Google Scholar]
- 5.Cheng H. D., Cai X., Chen X., Hu L., Lou X. Computer-aided detection and classification of microcalcifications in mammograms: a survey. Pattern Recognition. 2003;36(12):2967–2991. doi: 10.1016/s0031-3203(03)00192-4. [DOI] [Google Scholar]
- 6.Majid A. S., de Paredes E. S., Doherty R. D., Sharma N. R., Salvador X. Missed breast carcinoma: pitfalls and pearls. Radiographics. 2003;23(4):881–895. doi: 10.1148/rg.234025083. [DOI] [PubMed] [Google Scholar]
- 7.Youk J. H., Kim E.-K., Kim M. J., Kwak J. Y., Son E. J. Performance of hand-held whole-breast ultrasound based on BI-RADS in women with mammographically negative dense breast. European Radiology. 2011;21(4):667–675. doi: 10.1007/s00330-010-1955-8. [DOI] [PubMed] [Google Scholar]
- 8.Loukas C., Kostopoulos S., Tanoglidi A., Glotsos D., Sfikas C., Cavouras D. Breast cancer characterization based on image classification of tissue sections visualized under low magnification. Computational and Mathematical Methods in Medicine. 2013;2013:7. doi: 10.1155/2013/829461.829461 [DOI] [PMC free article] [PubMed] [Google Scholar]
- 9.Chen X., Mou X., Zhang L. Medical Biometrics. Vol. 4901. Berlin, Germany: Springer; 2007. Indicator and calibration material for microcalcifications in dual-energy mammography; pp. 265–272. (Lecture Notes in Computer Science). [DOI] [Google Scholar]
- 10.Johns P. C., Yaffe M. J. Theoretical optimization of dual-energy x-ray imaging with application to mammography. Medical Physics. 1985;12(3):289–296. doi: 10.1118/1.595766. [DOI] [PubMed] [Google Scholar]
- 11.Kappadath S. C., Shaw C. C. Dual-energy digital mammography for calcification imaging: scatter and nonuniformity corrections. Medical Physics. 2005;32(11):3395–3408. doi: 10.1118/1.2064767. [DOI] [PubMed] [Google Scholar]
- 12.Chung H., Ikejimba L., Kiarashi N., Samei E., Hoernig M., Lo J. Estimating breast density with dual energy mammography: a simple model based on calibration phantoms. Medical Imaging 2013: Physics of Medical Imaging; March 2013; p. p. 6. [DOI] [Google Scholar]
- 13.Lemacks M. R., Kappadath S. C., Shaw C. C., Liu X., Whitman G. J. A dual-energy subtraction technique for microcalcification imaging in digital mammography—a signal-to-noise analysis. Medical Physics. 2002;29(8):1739–1751. doi: 10.1118/1.1494832. [DOI] [PubMed] [Google Scholar]
- 14.Brandan M.-E., Ramírez V. Evaluation of dual-energy subtraction of digital mammography images under conditions found in a commercial unit. Physics in Medicine and Biology. 2006;51(9):2307–2320. doi: 10.1088/0031-9155/51/9/014. [DOI] [PubMed] [Google Scholar]
- 15.Arvanitis C. D., Bohndiek S. E., Royle G., et al. Empirical electro-optical and x-ray performance evaluation of CMOS active pixels sensor for low dose, high resolution x-ray medical imaging. Medical Physics. 2007;34(12):4612–4625. doi: 10.1118/1.2804744. [DOI] [PubMed] [Google Scholar]
- 16.Arvanitis C. D., Speller R. Quantitative contrast-enhanced mammography for contrast medium kinetics studies. Physics in Medicine and Biology. 2009;54(20):6041–6064. doi: 10.1088/0031-9155/54/20/002. [DOI] [PubMed] [Google Scholar]
- 17.Konstantinidis A. C., Szafraniec M. B., Speller R. D., Olivo A. The Dexela 2923 CMOS X-ray detector: a flat panel detector based on CMOS active pixel sensors for medical imaging applications. Nuclear Instruments and Methods in Physics Research Section A: Accelerators, Spectrometers, Detectors and Associated Equipment. 2012;689:12–21. doi: 10.1016/j.nima.2012.06.024. [DOI] [Google Scholar]
- 18.Gong J. K., Arnold J. S., Cohn S. H. The density of organic and volatile and non volatile inorganic components of bone. The Anatomical Record. 1964;149:319–324. doi: 10.1002/ar.1091490302. [DOI] [PubMed] [Google Scholar]
- 19. Remote RadEye Systems Rad-icon Imaging Corporation a division of Dalsa, Sunnyvale, Calif, USA, http://pdf.directindustry.com/pdf/rad-icon-imaging-corporation/remote-radeye-product-family-datasheet/21698-74362.html.
- 20.Michail C. M., Spyropoulou V. A., Fountos G. P., et al. Experimental and theoretical evaluation of a high resolution CMOS based detector under X-ray imaging conditions. IEEE Transactions on Nuclear Science. 2011;58(1):314–322. doi: 10.1109/tns.2010.2094206. [DOI] [Google Scholar]
- 21.Michail C. M., Fountos G. P., Liaparinos P. F., et al. Light emission efficiency and imaging performance of Gd2O2S:Eu powder scintillator under X-ray radiography conditions. Medical Physics. 2010;37(7):3694–3703. doi: 10.1118/1.3451113. [DOI] [PubMed] [Google Scholar]
- 22.Hammerstein G. R., Miller D. W., White D. R., Masterson M. E., Woodard H. Q., Laughlin J. S. Absorbed radiation dose in mammography. Radiology. 1979;130(2):485–491. doi: 10.1148/130.2.485. [DOI] [PubMed] [Google Scholar]
- 23.Hubbell J., Seltzer S. NISTIR. 5632. US Department of Commerce; 1995. Tables of X-ray mass attenuation coefficients and mass energy absorption coefficients 1 keV to 20 MeV for elements Z = 1 to 92 and 48 additional substances of dosimetric interest. [Google Scholar]
- 24.European Commission. EUR 16260 En. European Commission; 1996. European guidelines on quality criteria for diagnostic radiographic images. [Google Scholar]
- 25.Crotty D. J., McKinley R. L., Tornai M. P. Experimental spectral measurements of heavy K-edge filtered beams for x-ray computed mammotomography. Physics in Medicine and Biology. 2007;52(3):603–616. doi: 10.1088/0031-9155/52/3/005. [DOI] [PMC free article] [PubMed] [Google Scholar]
- 26.Martini N., Koukou V., Michail C., et al. Pencil beam spectral measurements of Ce, Ho, Yb, and Ba powders for potential use in medical applications. Journal of Spectroscopy. 2015;2015:8. doi: 10.1155/2015/563763.563763 [DOI] [Google Scholar]
- 27.Boone J. M., Seibert J. A. An accurate method for computer-generating tungsten anode X-ray spectra from 30 to 140 kV. Medical Physics. 1997;24(11):1661–1670. doi: 10.1118/1.597953. [DOI] [PubMed] [Google Scholar]
- 28.Samei E., Saunders R. S. Dual-energy contrast-enhanced breast tomosynthesis: optimization of beam quality for dose and image quality. Physics in Medicine and Biology. 2011;56(19):6359–6378. doi: 10.1088/0031-9155/56/19/013. [DOI] [PMC free article] [PubMed] [Google Scholar]
- 29. Del Medical Systems Group, Roselle, Ill, USA, http://www.delmedical.com.
- 30.Abbene L., La Manna A., Fauci F., Gerardi G., Stumbo S., Raso G. X-ray spectroscopy and dosimetry with a portable CdTe device. Nuclear Instruments and Methods in Physics Research, Section A. 2007;571(1-2):373–377. doi: 10.1016/j.nima.2006.10.112. [DOI] [Google Scholar]
- 31.ACR. Mammography, Quality Control Manual. Reston, Va, USA: American College of Radiology; 1999. [Google Scholar]
- 32.Boone J. M. Glandular breast dose for monoenergetic and high-energy x-ray beams: Monte Carlo assessment. Radiology. 1999;213(1):23–37. doi: 10.1148/radiology.213.1.r99oc3923. [DOI] [PubMed] [Google Scholar]
- 33.Code of Federal Regulations. Title: 21 Food and Drugs, Part 900-Mammography, Subpart B-Quality Standards and Certification, 21CFR900, 2014, http://www.accessdata.fda.gov/scripts/cdrh/cfdocs/cfCFR/CFRSearch.cfm?CFRPart=900&showFR=1.


