Figure 3.

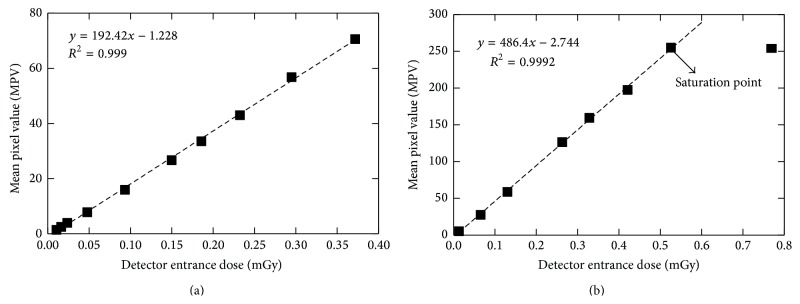
Plot of mean pixel value as a function of the detector entrance dose for the low-energy beam (a) and the high-energy beam (b). The point at the right in (b) was ignored in the linear regression, since it was above the saturation point.

Plot of mean pixel value as a function of the detector entrance dose for the low-energy beam (a) and the high-energy beam (b). The point at the right in (b) was ignored in the linear regression, since it was above the saturation point.