
Figure 2. Averaging many independent events provided very accurate net modification mass differences (sub-PPM).
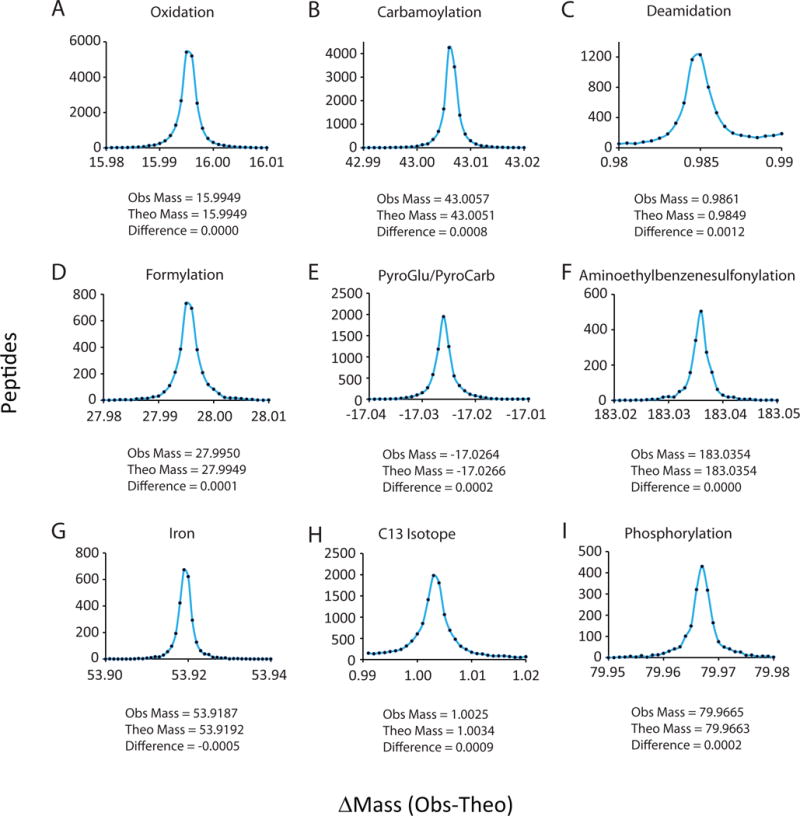
A–L) Examples of residual mass bins from Figure 1C showing the frequency of peptide identifications and the average mass difference. Bins are drawn at 0.001 Da intervals. The deduced modification is also shown.