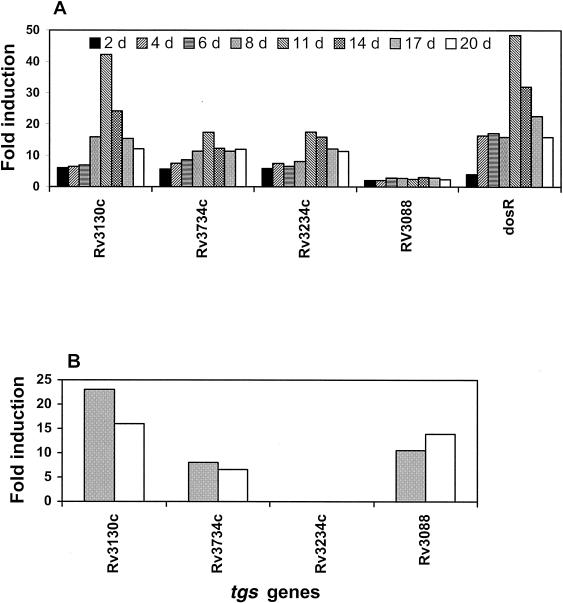
FIG. 2.
(A) Real-time PCR measurement of the most highly induced tgs genes in M. tuberculosis H37Rv during the gradual depletion of O2. Transcript levels were measured by real-time PCR, and data were analyzed by comparative CT method (ΔΔCT) for relative quantitation of gene expression. The induction level of dosR (Rv3133c) is shown for comparison. (B) Real-time PCR measurement of the most highly induced tgs genes in M. tuberculosis H37Rv by NO treatment. Quantitation of transcript levels was done by real-time PCR, and data were analyzed as for panel A but using the spermine control as the reference. The maximal level was reached within 4 h of the first NO treatment (gray bars) and within 4 h of the second NO treatment 16 hours after the initial NO treatment (open bar).

