
Figure 1.
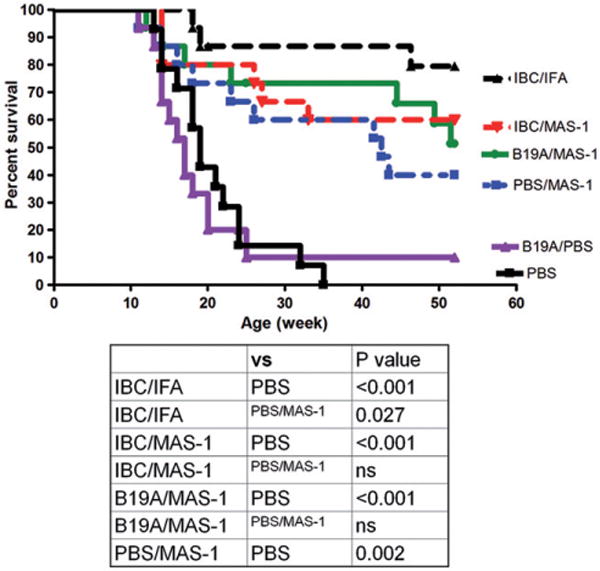
Cumulative percentages of diabetes-free mice over time for each study group. Black triangle (broken line) = IBC/IFA; red triangle = IBC/MAS-1 group; green circle = B19A/MAS-1 group; blue square = PBS/MAS-1 adjuvant emulsion; purple triangle = B19A/PBS non-adjuvanted ASI control group; black square = PBS normal control group. n = 15 for each group. Statistical analysis comparing the protection afforded by different treatment groups is included.