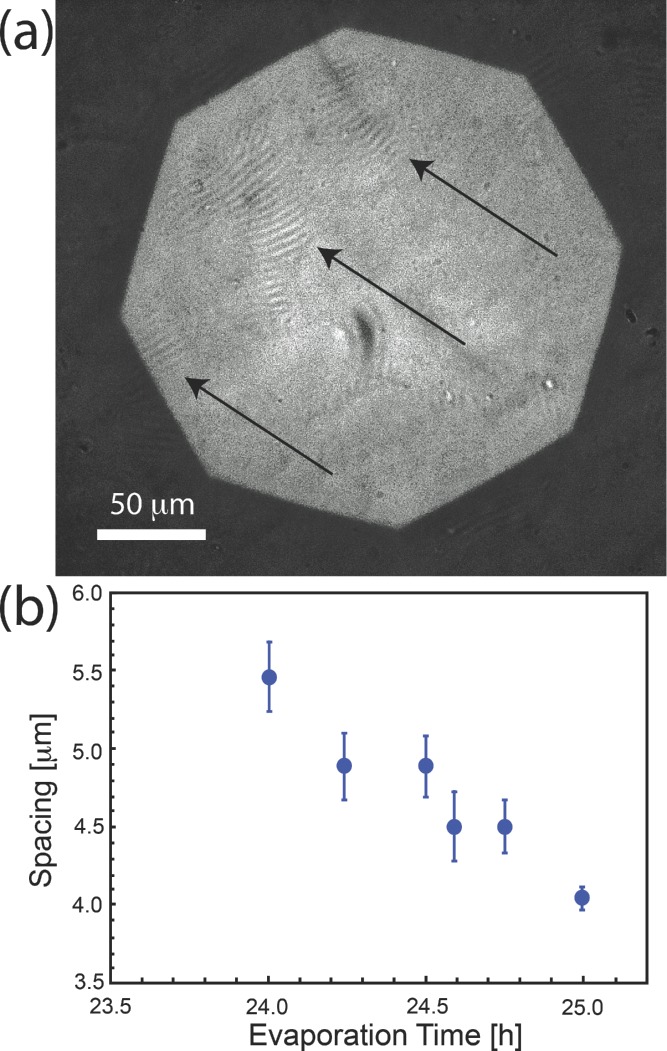
Figure 2.
Tactoid formation at the second stage of evaporation. (a) Optical micrograph of tactoids obtained after 25 h of evaporation in atmosphere with a humidity of 80%. The arrows highlight the positions of the tactoids. (b) Inter-plane distances measured from microscopy images as a function of the evaporation time.

