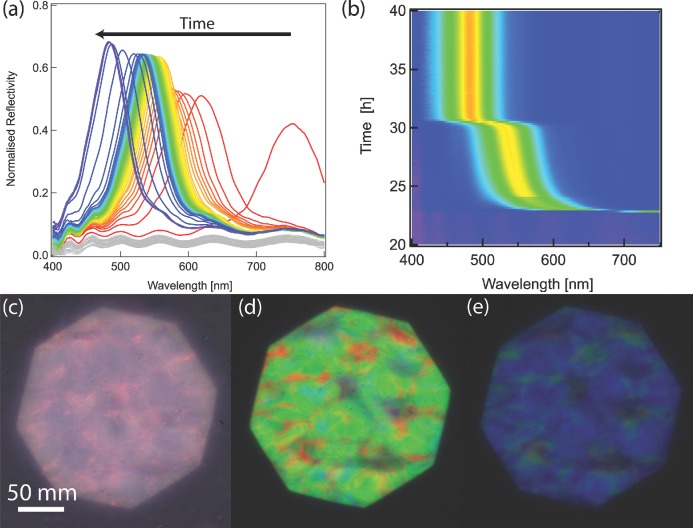
Figure 3.
Color variation of a drying film prepared from a 1.1% suspension of cellulose CNCs. (a) Selected reflection spectra during evaporation. The red-to-blue color scale represents the evaporation time. The traces in grey are from the earlier stage of the evaporation process when the suspension has not formed its color yet. (b) Time evolution of the peak, which appears after 23 h, with reflected intensity plotted on a blue-to-red color scale. (c–e) Images collected in left circular polarisation for increasing film formation times of 23, 25, and 40 h, respectively. The contrast in (c) is low because of the limited sensitivity of the camera in the near-infrared.

