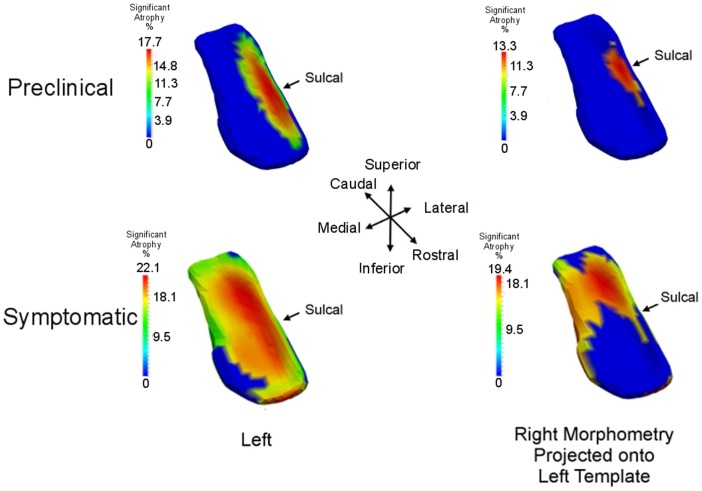
Figure 11.
Longitudinal time-series Model I: spreading of significant morphometry marker from preclinical (top row) to symptomatic (bottom row); left column shows left ERC population change in left ERC template, right column shows right ERC projected onto the left ERC template. Atrophy visualization for FWER at 5% as measured by linear effects. Color codes percentage decrease of surface area from control to preclinical group (top row) and control to symptomatic group (bottom row), given by , the average age of the preclinical group (top) and symptomatic group (bottom). All significant change (non-blue) is atrophy with maximum changes of 18% for preclinical and 22% for symptomatic; blue is non-significant vertices with all change atrophy. Sulcal partition is S from high-field atlas.

