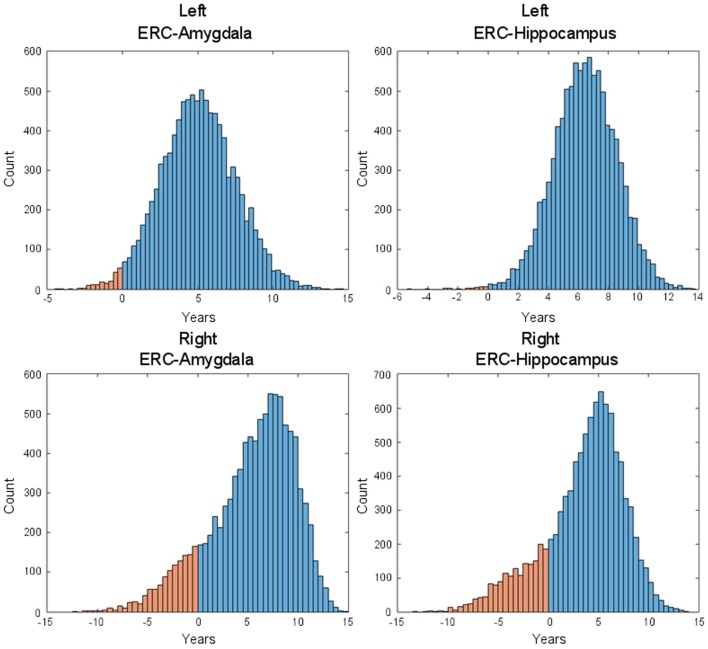
Figure 8.
Histogram of time-difference between estimated changepoints for left-side (first row) and right-side (second row) structures (left: ERC – Amygdala; right: ERC – Hippocampus) based on 10,000 bootstrap samples. On the left side, onset times were found larger in ERC than in Amygdala 98.1% of the time (87.5% on the right side) and larger in ERC than in hippocampus 99.7% of the time (82.5% on the right side), with respective median difference of 5.0 and 6.5 years (6.2 and 4.3 on the right side).

