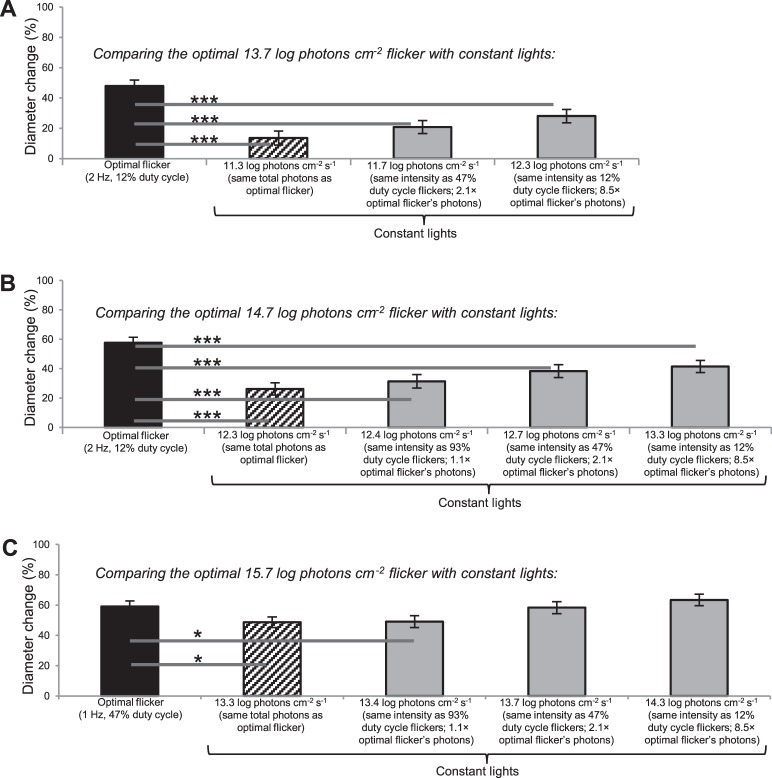
Figure 5.
Comparisons with responses to constant lights. The optimal flicker responses shown in Fig. 3 are replotted here (black columns) and compared with responses to constant lights that have either the same photon counts as the optimal flickers (hashed columns) or the same intensities as the various flicker duty cycles (gray columns). * P < 0.05. *** P < 0.001. Five subjects participated, each contributing two trials to all 14 conditions.

