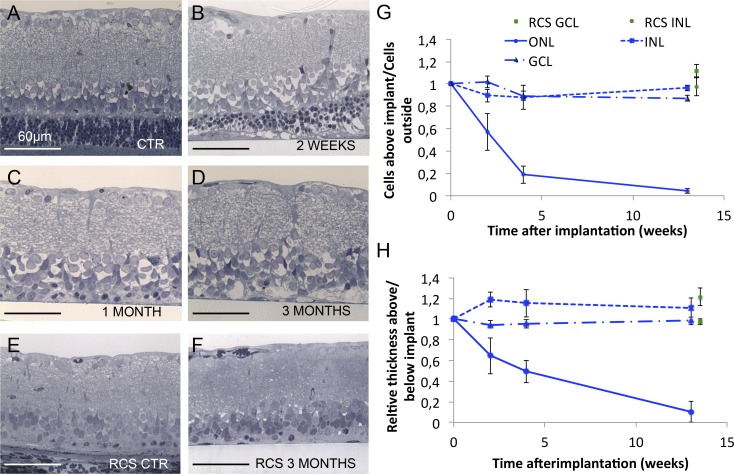
Figure 3.
Dynamics of retinal degeneration. (A) Control retina outside the implanted area. (B–D) Retina above the implant 2 weeks, 1 month, and 3 months after surgery, respectively, illustrating the progressive loss of PR cell bodies and stability of the inner retina. (E, F) The RCS retina outside of the implanted area and above the implant 3 months after surgery. The subretinal implantation does not seem to affect the RCS retina. (G) Number of nuclei in various layers above the implant over time. The number of photoreceptor nuclei (ONL) decrease to 4% at 12 weeks after surgery, while the GCL and INL numbers remain similar to control. Similarly, implantation in RCS rats does not affect the number of cells in these layers. (H) Relative thickness of the retinal layers above the implant compared to control area. The photoreceptor layer thickness follows similar decrease reflecting the loss of nuclei, whereas the GCL thickness remains stable. Interestingly, the INL slightly widens 2 weeks after implantation, and then returns to the baseline level over time.

