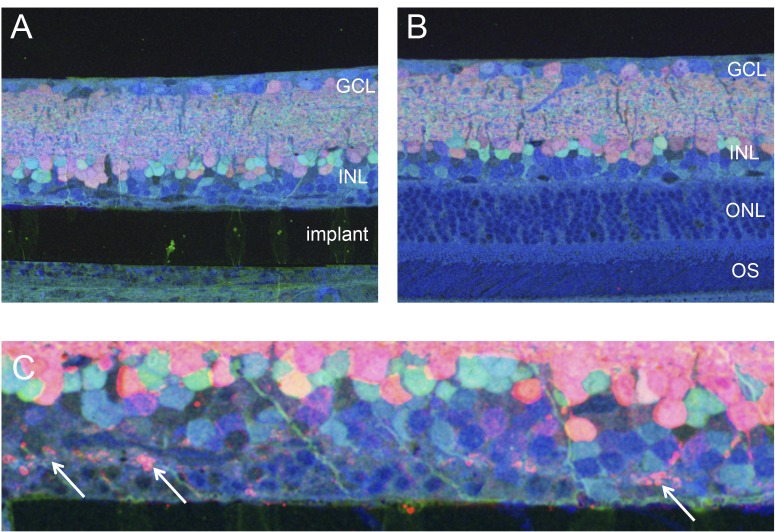
Figure 4.
Molecular phenotyping of the implanted retina. (A, B) Implanted and control areas labeled with GABA (red), glycine (green), and glutamate (blue) revealing the cell types and dendrites. (C) Higher magnification reveals ectopic synapses (white arrows) as signs of degeneration in the outer plexiform layer.

