
Figure 2. Recapitulating the patterns reported by the mouse ENCODE papers.
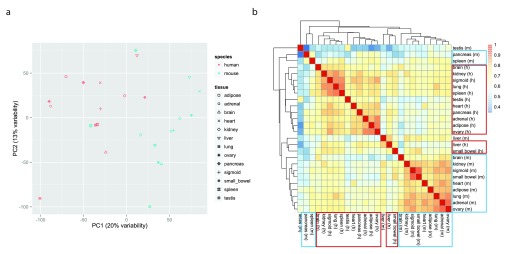
a. Two-dimensional plots of principal components calculated by performing PCA of the transposed log-transformed FPKM values (from 14,744 orthologous gene pairs) for the 26 samples, after removal of invariant columns (genes). b. Heatmap based on pairwise Pearson correlation of expression data used in panel a. We used Euclidean distance and complete linkage as distance measure and clustering method, respectively.