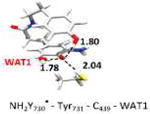
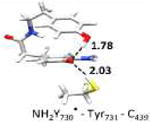
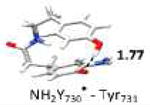
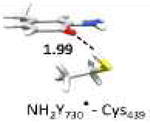
Table 2. Comparison of computed g-values from DFT models with experiment.
| gx | gy | gz | ||
|---|---|---|---|---|
| 1 | Experiment | 20052 | 2.0042 | 2.0022 |
| DFT model | Deviation from experiment [in ppt] | |||
| 2 | Model 4 (with WAT1) | -0.3 | -0.1 | -0.4 |
| 3 | Model 6 (wirhout WATl) | -0.1 | -0.1 | -0.3 |
| 4 |

|
-0,6 | -0.3 | -0,5 |
| 5 |

|
-0.2 | -02 | -0.4 |
| 6 |

|
0.3 | 0.2 | -0.2 |
| 7 |

|
0.8 | 0,1 | -0,4 |
| S |
|
0.9 | 0.3 | 0.0 |
| 9 |

|
1.7 | 0,4 | 0.0 |
The optimized structure without water (entry 3, model 6) is shown in Figure S5. The optimized structure with water (entry 2, model 4) is shown in Figure 4. Small model systems were obtained by omitting residues of model 4, which are not involved in the PCET pathway. Hydrogen bond lengths are given in Å. Geometries and EPR parameters are calculated using COSMO (ε = 4.0). The uncertainty in the experimental values (entry 9) at 180 GHz is ± 0.1 ppt. The unit ppt refers as part per thousand of the g-value.
