
Graph 3.
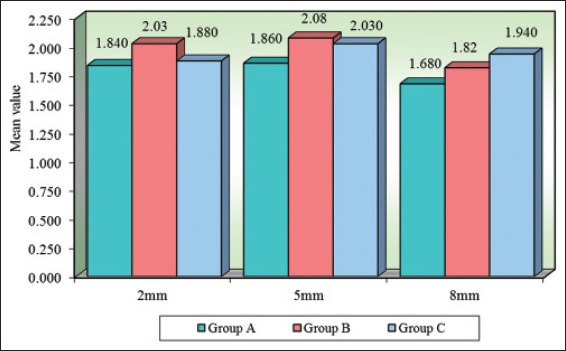
Comparison of three groups (A, B, C) with respect to canal centering ratio scores at 2 mm, 5 mm, and 8 mm.
Official websites use .gov
A
.gov website belongs to an official
government organization in the United States.
Secure .gov websites use HTTPS
A lock (
) or https:// means you've safely
connected to the .gov website. Share sensitive
information only on official, secure websites.
Comparison of three groups (A, B, C) with respect to canal centering ratio scores at 2 mm, 5 mm, and 8 mm.