Table 2.
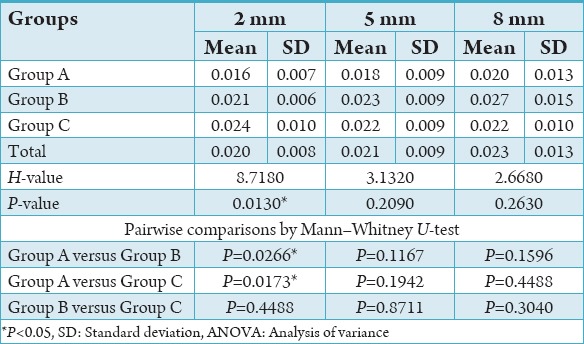
Comparison of three groups (A, B, C) with respect to transportation scores at 2 mm, 5 mm, and 8 mm by Kruskal–Wallis ANOVA.

Comparison of three groups (A, B, C) with respect to transportation scores at 2 mm, 5 mm, and 8 mm by Kruskal–Wallis ANOVA.
