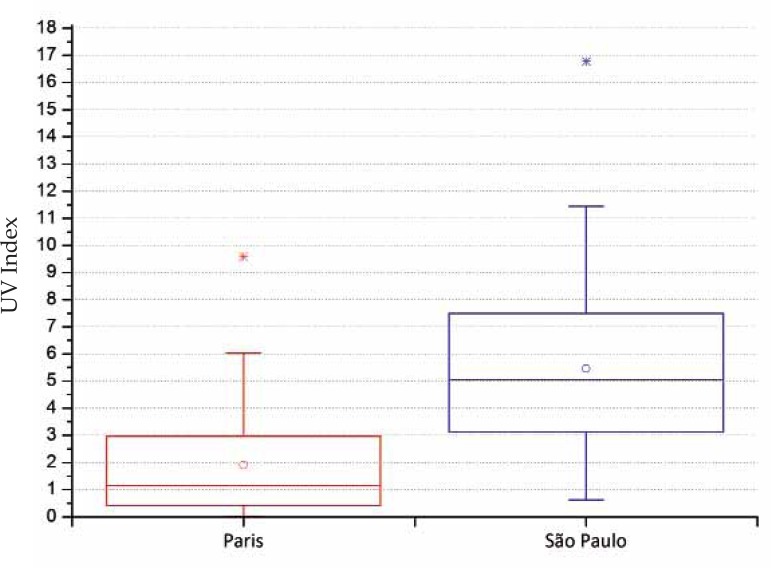
FIGURE 7.
Boxplot of UVI reading databases. Readings taken around solar noon (one hour before and one hour after) in the cities of Paris (2011-2013)27 and São Paulo (2006- 2009),25. The circle indicates the average, the boxplots show the 5° and 95° percentile and the asterisk the maximum value found in the period
Source: de Paula Corrêa M, et al, 201024; de Paula Corrêa M, et al, 201325 and Jégou F, et al 201127

