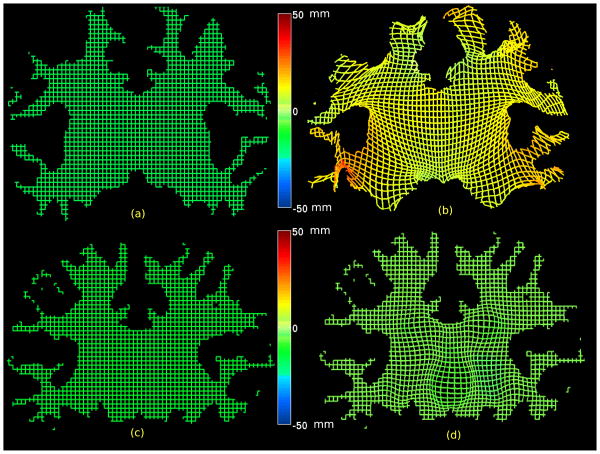
Fig. 8.
Illustration of the effects of the two stages of volumetric matching is shown by applying the deformations to a regular mesh representing one slice. Since the deformation is in 3d, the third in-paper value is represented by color. (a) Regular mesh representing one slice in the subject; (b) the regular mesh warped by the harmonic mapping which matches the subject cortical surface to the template cortical surface. Note that deformation is largest near the surface since the harmonic map is constrained only by the cortical surface; (c) Regular mesh representing one slice in the harmonically warped subject; (d) the intensity-based refinement now refines the deformation of the template to improve the match between subcortical structures. In this case the deformation is constrained to zero at the boundary and are confined to the interior of the volume.

