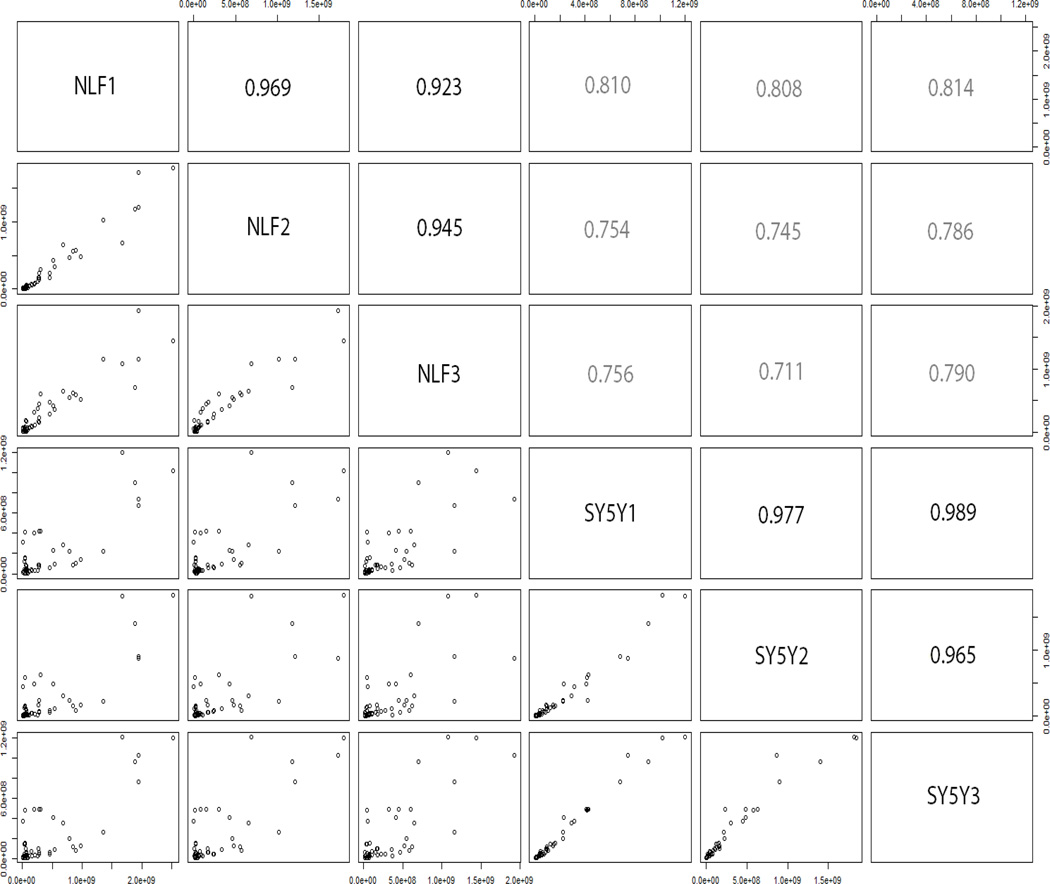
Figure 1.
Comparison of detected glycan abundances (measured as XICs) within and across NLF and SY5Y cell lines. The lower-diagonal plots show scatter plots of glycan abundances within two groups, with the upper-diagonal part of the matrix depicting the correlation measure. For example, the correlation between NLF1 and SY5Y3 cell lines is depicted in the lower leftmost box, and the correlation coefficient is given in the upper rightmost box (0.815). The plot trends depict high correlation between technical replicates within cell lines (bolder text - indicative of good reproducibility) and low correlation across cell lines (lighter text-indicative of differences).

