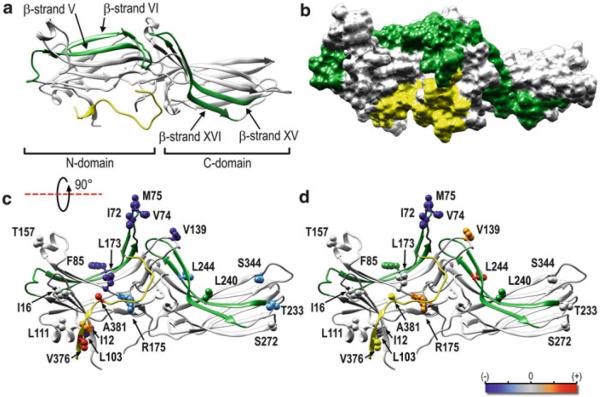
Fig. 1.
The receptor-binding interface has been mapped to the concave side of both domains in all arrestin subtypes. (a) Ribbon representation of bovine arr-1 based on PDB: 1CF1 (Hirsch et al. 1999) as viewed from the receptor “viewpoint.” Arrestins consist of two domains linked by a flexible hinge and the C-tail that comes back from the C-domain and makes a strong contact with the β-strand I and α-helix I in the N-domain (see Chap. 7, Fig. 1). The β-strands V–VI and XV–XVI with adjacent loops, identified as key elements that determine receptor specificity (Vishnivetskiy et al. 2004), are shown in green; the C-tail (including the parts not resolved in crystal structures) is shown in yellow. (b) Space-filling model of arr-1, oriented and color coded as in panel (a). (c, d) Side view of arr-1 [90° rotation from the perspective shown in panel (a)] with spin-labeled residues (Hanson et al. 2006) shown as ball-and-stick models. The magnitude of the detected changes in spin-label mobility upon receptor binding is color coded as follows: gray (or green/yellow), no change; pink/red, small and large increases in mobility, respectively; lightblue/dark blue, small and large decreases in mobility, respectively. (c) Changes upon binding to dark (inactive) P-Rh. (d) Additional changes induced by light activation of P-Rh to P-Rh*. Upon binding to dark P-Rh (c), finger loop residues (I72, V74, M75) become less mobile, while the mobility of the C-tail residues increases. Light activation further decreases the mobility of the finger loop residues (d), while mobility of V139 increases [this loop was later shown to move out of the way of incoming receptors (Kim et al. 2012; Vishnivetskiy et al. 2013)]. Ribbon and surface cartoons rendered with UCSF Chimera 1.8

