
Figure 2.
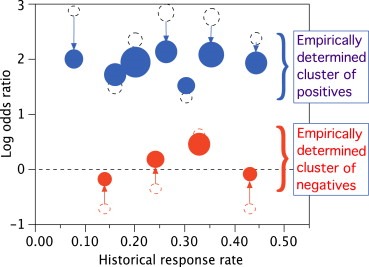
Open dashed circles show raw response rates for 11 tumor types. Solid circles show estimates adjusted for hierarchical borrowing from other tumor types and accounting for clustering. The area of each open circle is proportional to the actual sample size, which varies by a factor of greater than 2 across the tumor types. The area of each solid circle is proportional to the “equivalent sample size,” which is increased to demonstrate the greater precision of estimation that is effected by hierarchical borrowing. Raw estimates for tumor types with smaller sample sizes, further from the overall mean, and further from the cluster mean are regressed further. Tumor types with raw estimates further from the cluster mean borrow less and therefore have less increase in precision. (Results are hypothetical and effects are exaggerated to demonstrate the methodology.)