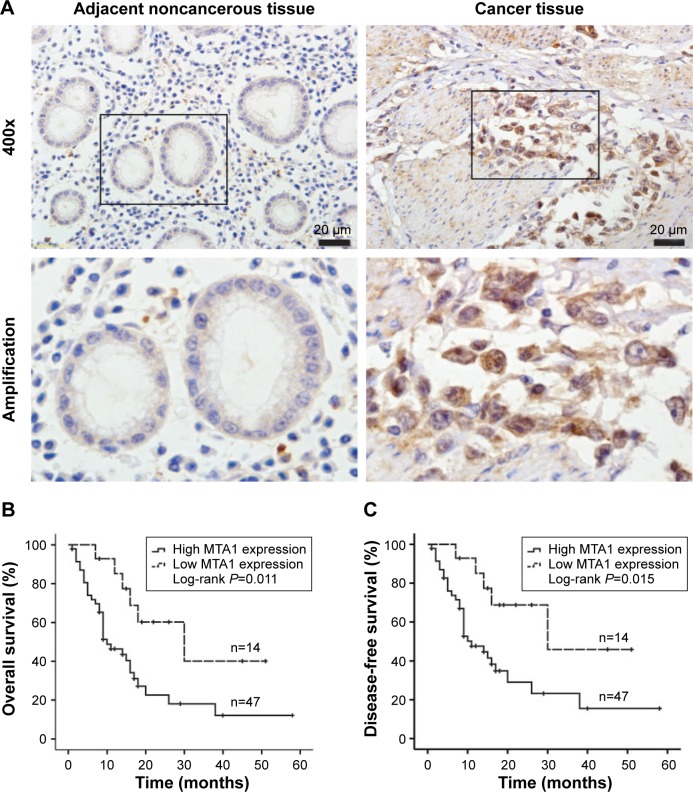
Figure 1.
Kaplan–Meier survival curves for overall survival and disease-free survival of gastric cancer patients stratified by MTA1 expression.
Notes: (A) Immunohistochemistry analysis of representative expression patterns of MTA1 in the human gastric cancer tissues and adjacent noncancerous tissues. Positive MTA1 staining in gastric cancer tissues appeared as brown particles which were mainly localized within the nucleus of epithelial cells. Original magnification: all 400×. Scale bar: 20 µm. (B) overall survival curves of gastric cancer patients according to MTA1 immunostaining. (C) Disease-free survival curves of gastric cancer patients according to MTA1 immunostaining. P-values were obtained by log-rank test.
Abbreviation: MTA1, metastasis-associated protein 1.

