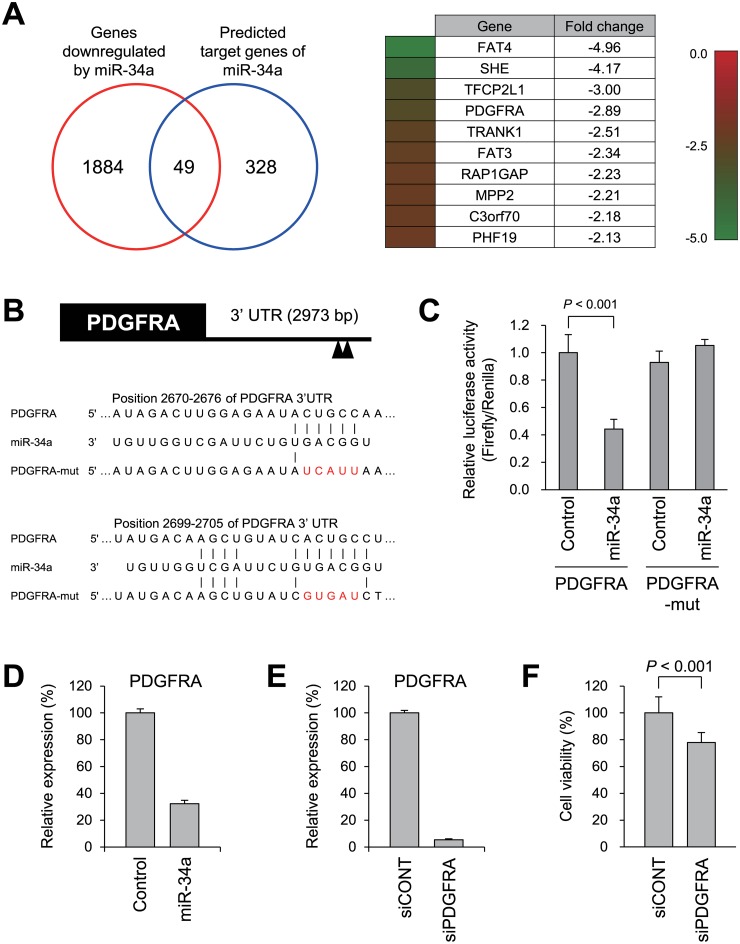
Fig 5. Downregulation of predicted miR-34a target genes in GIST-T1 cells.
(A) Venn diagram for genes downregulated by ectopic miR-34a expression in GIST-T1 cells (>1.5-fold) and predicted miR-34a target genes. Of the 49 downregulated target genes, the top 10 genes are listed on the right. Expression levels and fold-changes are also indicated. (B) Putative miR-34a binding sites in the 3’ untranslated region (UTR) of PDGFRA. Mutant binding sites used for the luciferase assay are shown in red. (C) Reporter assay results using a luciferase vector containing the wild-type PDGFRA 3’ UTR (PDGFRA) or the mutant 3’ UTR (PDGFRA-mut) in GIST-T1 cells cotransfected a miR-34a mimic or a negative control. Shown are means of 4 replications; error bars represent standard deviations; the P value was determined using Student’s t test. (D) Quantitative RT-PCR of PDGFRA in GIST-T1 cells transfected with a miR-34a mimic or a negative control. (E) Quantitative RT-PCR of PDGFRA in GIST-T1 cells transfected with a siRNA targeting PDGFRA (siPDGFRA) or a control siRNA (siCONT). (F) Cell viability assays using GIST-T1 cells transfected with siCONT or siPDGFRA. Cell viabilities were determined 72 h after transfection. Shown are means of 8 replications; error bars represent standard deviations; the P value was determined using Student’s t test.

