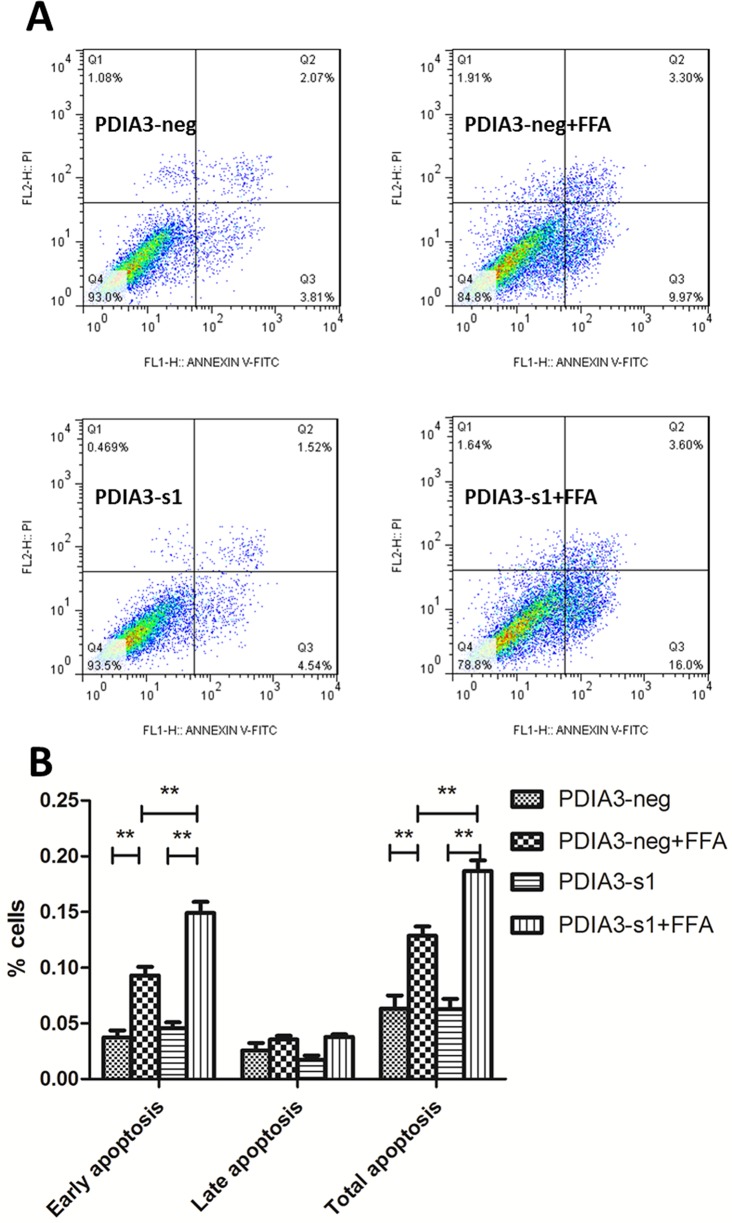
Fig 4. PDIA3 siRNA aggravates cellular apoptosis of steatotic L02 cells.
(A) Flow cytometry scatter plot after Annexin V-FITC/PI staining: left lower quadrant: normal cells; right lower quadrant: early apoptosis cells (FITC Annexin V positive and PI negative); right upper quadrant: late apoptosis cells (both FITC Annexin V and PI positive); left upper quadrant: necrotic cells. The percentage represents the proportion of cells in each quadrant. (B) The histogram of early, late and total apoptosis after three independent experiments. **P<0.01.

