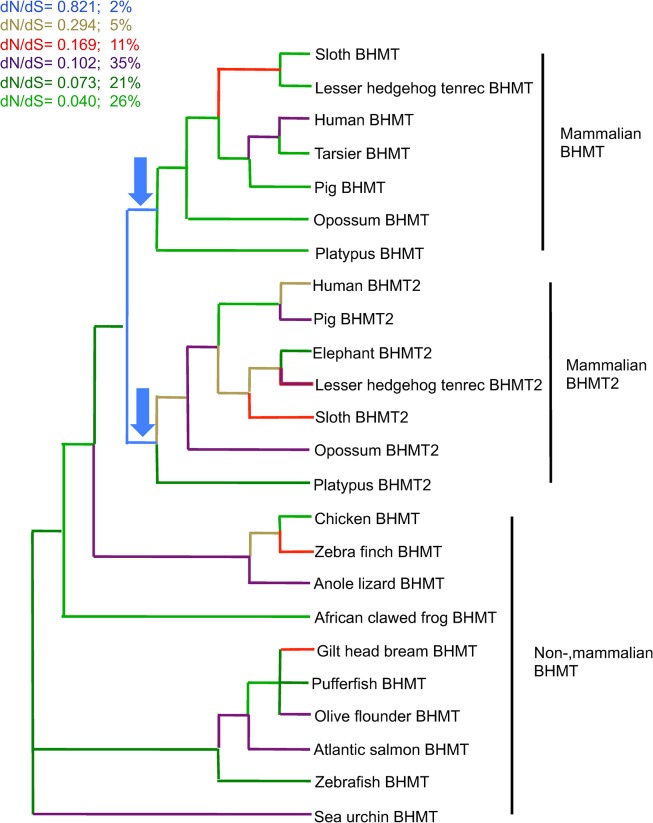
Fig 3. Ratio of substitutions per site across a phylogeny of BHMT and BHMT2 coding sequences.
The phylogenetic relationships across taxa were constrained based on known evolutionary relationships (http://tolweb.org) [29]. GA Branch analysis selected a model with six classes of dN/dS; next to the color code is indicated the percent proportion of branches in the tree in each class (as a percentage of total tree length measured in expected substitutions per site per unit time). The arrows point to the branches with the highest values of dN/dS, indicating that selective constraints were most relaxed immediately after gene duplication in the lineage ancestral to all living mammals. Relatively higher positive selection, or relatively lower purifying selection, may have affected both BHMT and BHMT2 in the evolutionary interval that immediately followed gene duplication.

