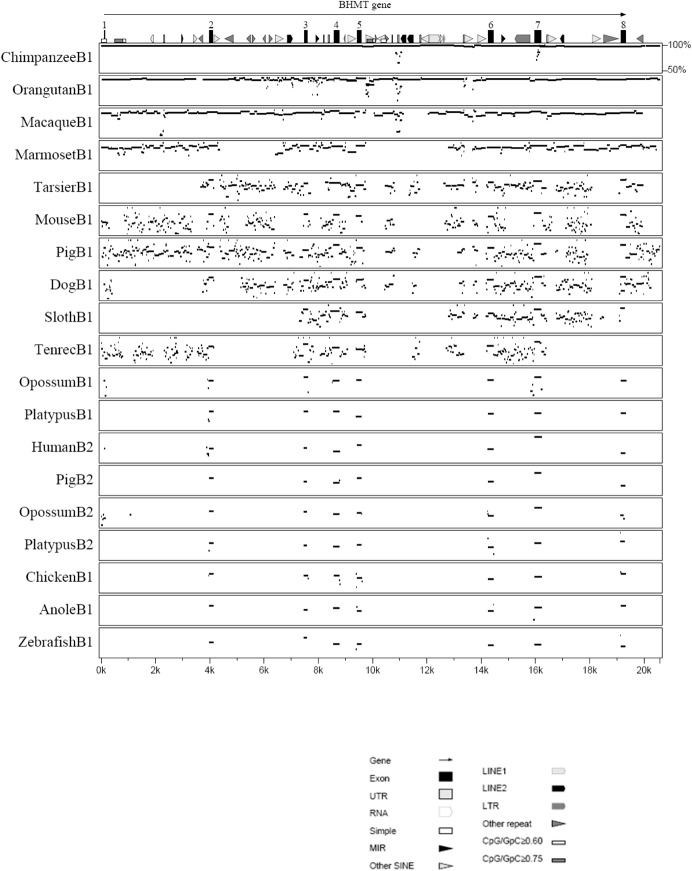
Fig 4. Identity (multipip) plot comparing DNA sequences across species, using human BHMT as a reference.
Features present within human BHMT are shown at the top of the figure, with the key shown below the figure Sequences compared [43] are those of BHMT (B1) or BHMT2 (B2) for the species listed; the horizontal lines depict the regions of BHMT or BHMT2 for each species that are similar to human BHMT, with the vertical positioning of the line proportionate to the percentage of similarity. Blank regions indicate that sequence similarity was below 50% or that genome coverage was not available for the non-human species. Note that as the evolutionary distance between species increases, the similarity of their sequences decreases; and that B1 and B2 sequences within the same species are not conserved, reflecting their origins in an ancient duplication at the root of the mammalian divergence. The coding regions (exon 2 through exon 8) are highly conserved.

