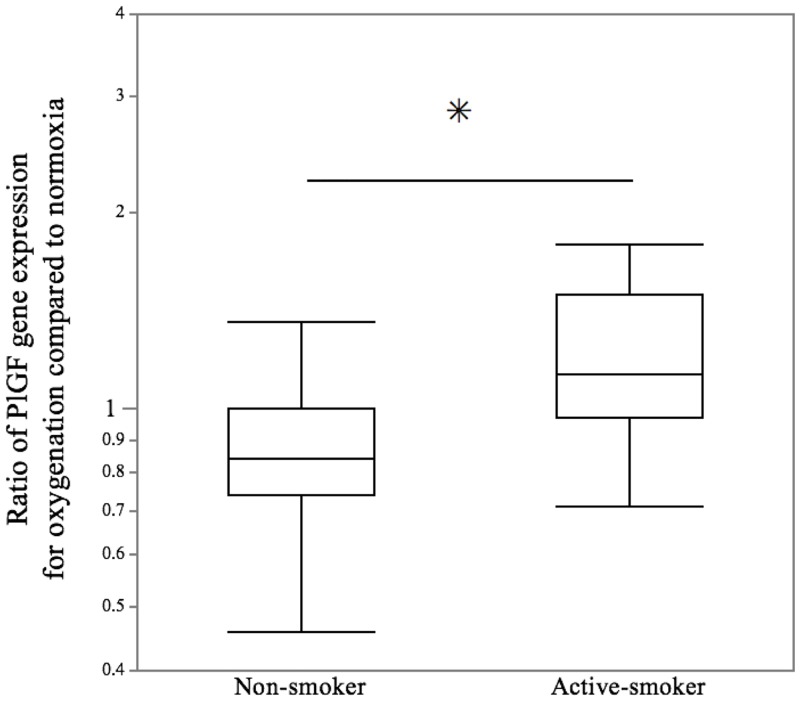
Fig 2. Ratio of PlGF gene expression in invasive trophoblasts under oxygenation compared to normoxia conditions.
Using real-time quantitative PCR analyses, the ratio of PlGF gene expression in invasive trophoblasts under oxygenation in the active-smoker group was compared with the non-smoker group. The central bars represent the median values, boxes represent the interquartile ranges and whiskers represent the 90th and 10th percentiles. *p<0.05, in the comparison between the non-smokers and active-smokers.

