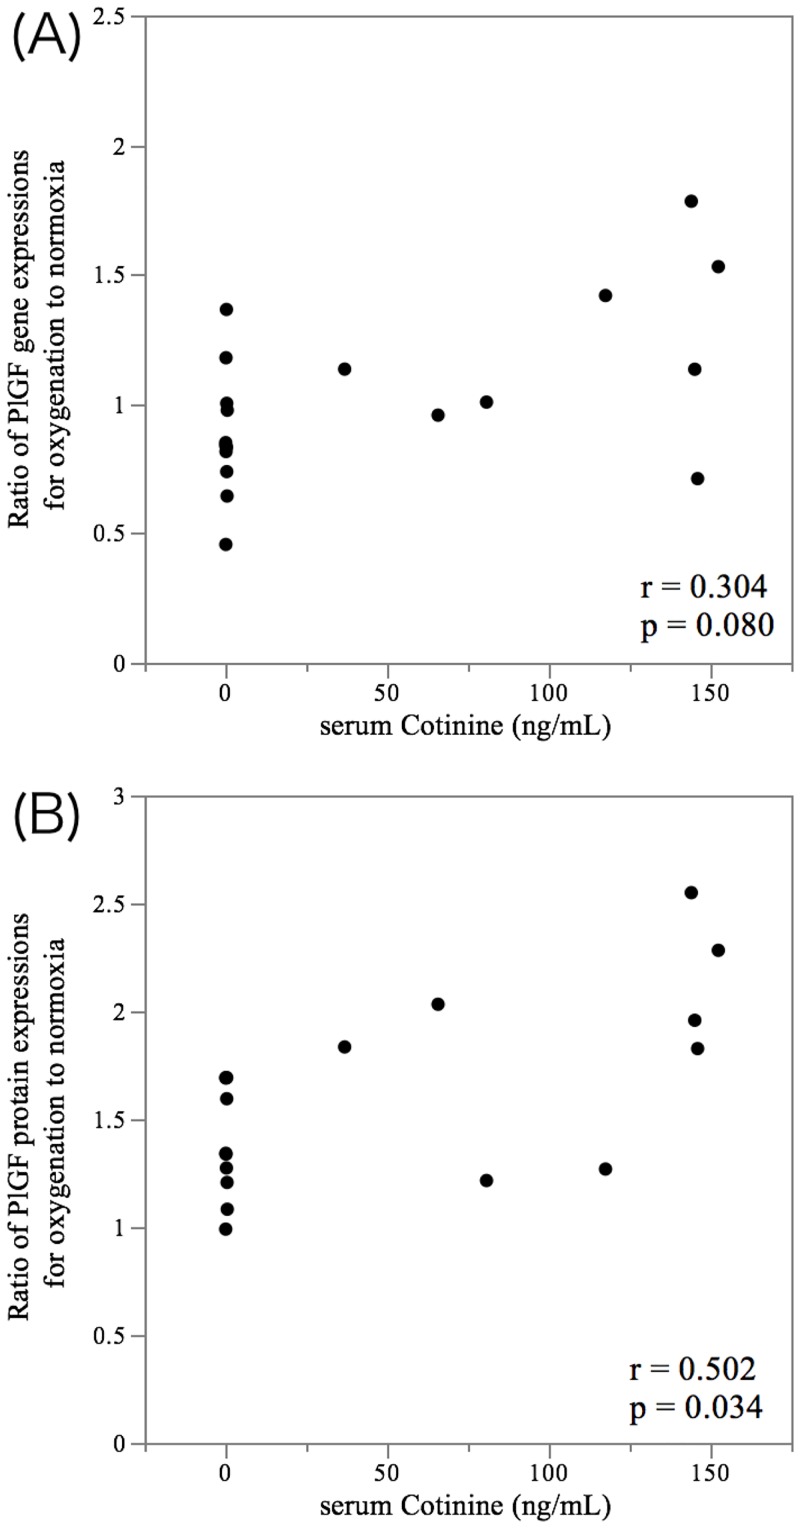
Fig 4. Correlation between the serum cotinine levels and the ratio of PlGF gene expression and protein under oxygenation.
Scatter plots show the correlations between the serum cotinine levels and the ratio of PlGF gene expressions (A) and the ratio of PlGF protein expressions (B) in invasive trophoblasts during oxygenation compared with normoxia conditions. The significance was calculated according to Spearman’s correlation.

