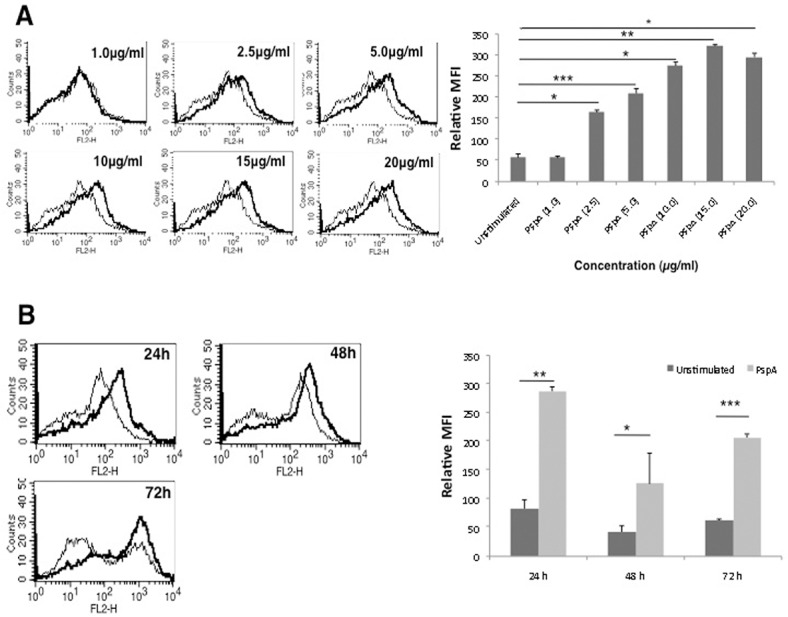
Fig 1. PspA upregulates expression of PD-L1 on DCs.

A, mouse bone marrow derived DCs were stimulated with indicated concentrations of PspA for 24h. B, DCs were stimulated with 15μg/ml PspA for indicated times. PD-L1 expression was monitored by flow cytometry. Bold lines represent expression levels in the presence of PspA while thin lines represent unstimulated controls. Data from one of three independent experiments are shown. The MFI values from three independent experiment (expressed as mean ± SD) are summarized as a bar graph in the right panel.
