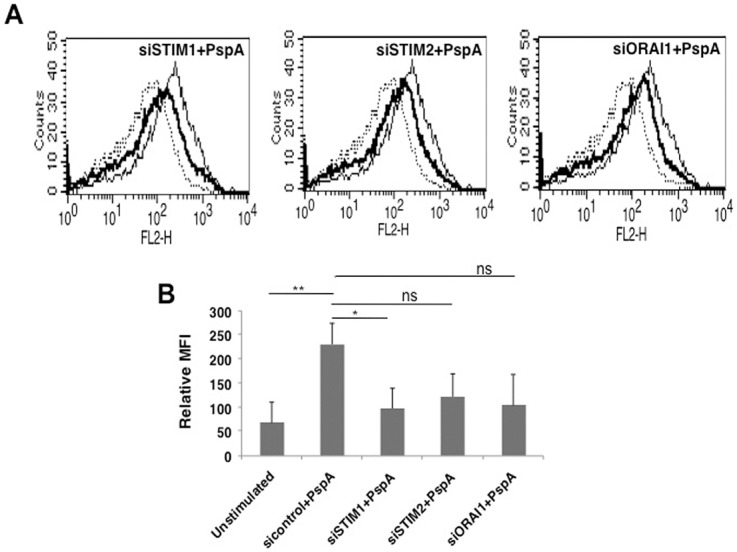
Fig 5. Molecular sensors of intracellular calcium regulate PspA induced PD-L1 expression.

For Panel A, mouse bone marrow derived DCs were transfected with siRNAs against indicated molecules for 36h, followed by stimulation with 15 μg/ml PspA for 24h. PD-L1 levels were monitored by flow cytometry. Dotted lines represent unstimulated cells transfected with control siRNAs. Thin lines represent cells transfected with control siRNAs followed by stimulations with 15 μg/ml PspA. Bold lines represent cells transfected with siRNAs specific to the indicated molecules followed by stimulation with 15 μg/ml PspA. Data from one of three independent experiments is shown. In Panel B, PD-L1 expression is represented as bars indicating fold increase in Relative Mean Fluorescence Intensity (MFI) for various groups. In panel B, bars represent mean ± SD of three independent experiments. ‘ns’ represents non-significant differences between compared groups.
