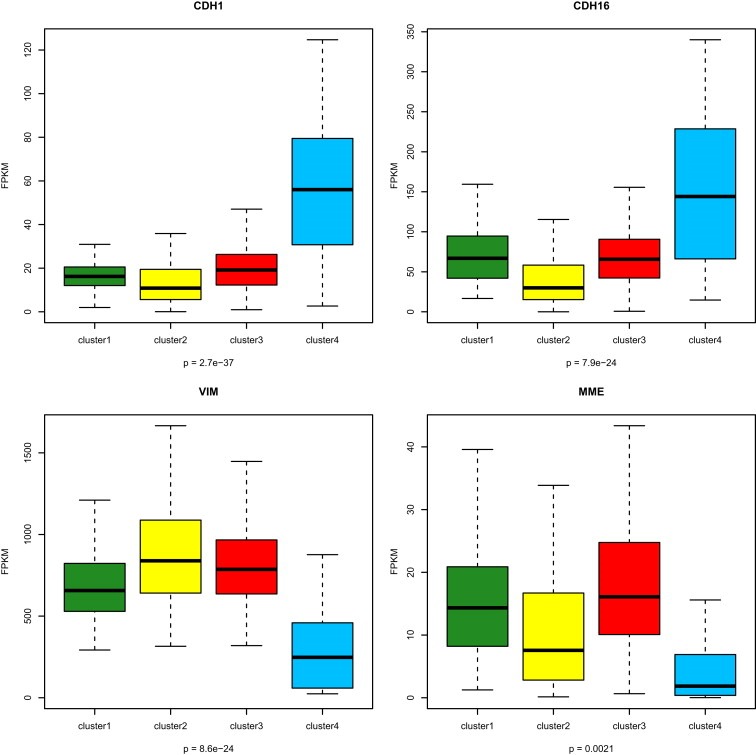
Figure 4.

Box‐plots for expression of genes associated with renal lineage specificity and showing that cluster C4 is associated with CDH1 and CDH16 overexpression, and VIM and MME downregulated expression. The p‐values in boxplot were calculated from one‐way ANOVA.
