
Figure 6.
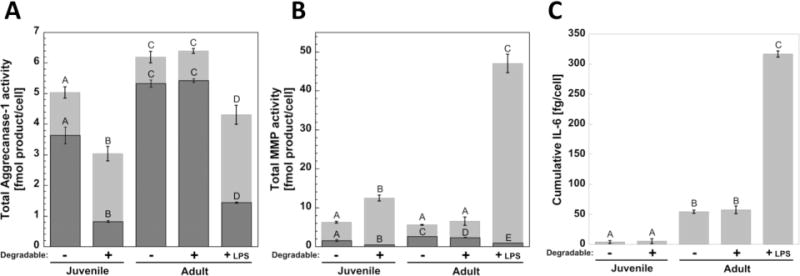
Activity of (A) aggrecanase-1 and (B) generic MMPs measured per cell within the constructs is shown by the (Image) bar and released to the culture medium is shown by the (Image) bar. The sum of the active enzyme in the constructs and released to the medium represents on average the total amount of active enzyme that was produced per cell over the entire 12 weeks. (C) Cumulative IL-6, shown as the additive quantity measured in the medium throughout 12 weeks. Letter groupings show statistical similarities (same letter) and differences (different letters) (p < 0.05). Top letters are for total activity in medium and lower letters are for total activity in constructs. Error bars are standard deviation (n = 3).