
Fig. 2.
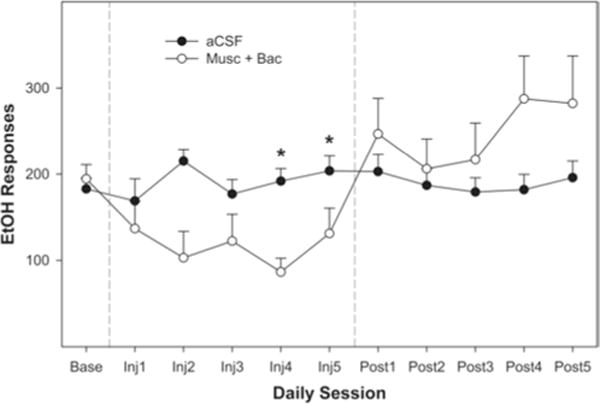
Line graph depicting the average number of EtOH-lever presses per 1-hour session during Week 9 (maintenance) over 5 days of microinjections. Each session represents 1 day of testing. Significant effects (noted by asterisks) were identified by ANOVA on Day 4 (p < 0.004) and Day 5 (p < 0.019). There were 10 rats in the aCSF group and 8 rats in the Bac-Mus group.