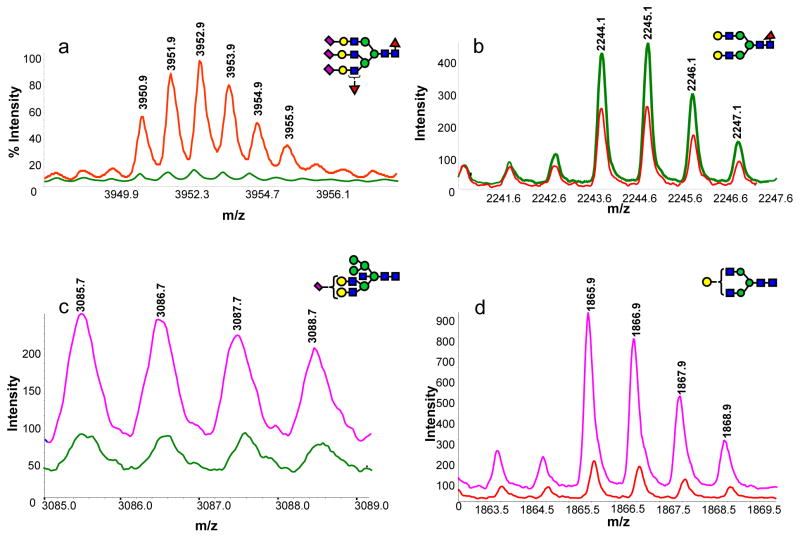
Figure 6.
MALDI mass spectra illustrating the difference in the intensity of N-glycans derived from human blood serum of (a, b) a disease-free subject (green trace) vs. patient with esophageal adenocarcinoma (red trace); (c) a disease free subject (green trace) vs. patient with HGD esophagus (pink trace) and (d) a patient with HGD esophagus (pink trace) vs. that with esophageal adenocarcinoma (red trace). Symbols: as in Figure 3

