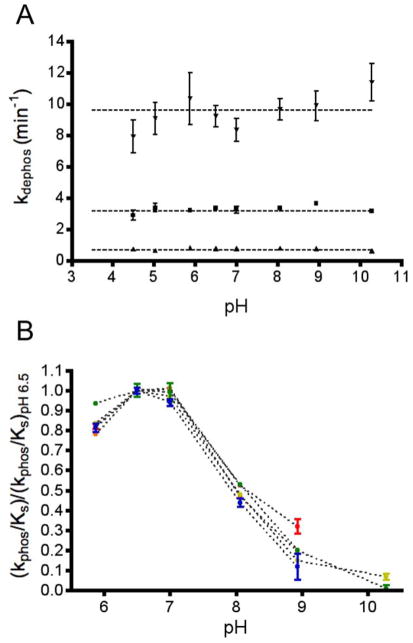
Figure 2.
pH sensitivities of autodephosphorylation and autophosphorylation rate constants. (A) Autodephosphorylation rate constants (mean and standard deviation, n≥3) are plotted for wild type CheY at 25 °C (squares), CheY DY at 25 °C (triangles), and CheY DR at 15 °C (inverted triangles). The rate constants were measured with fluorescence using the rapid dilution method. Horizontal lines indicate the autodephosphorylation rate constants measured by the pH jump method (pH 10.2). (B) Rate constants (mean and standard deviation, n 3) for autophosphorylation with PAM normalized to the rate at pH 6.5 for wild type CheY (red), CheY DR (green), CheY DK (orange), CheY DY (yellow), and CheY DQ (blue).

