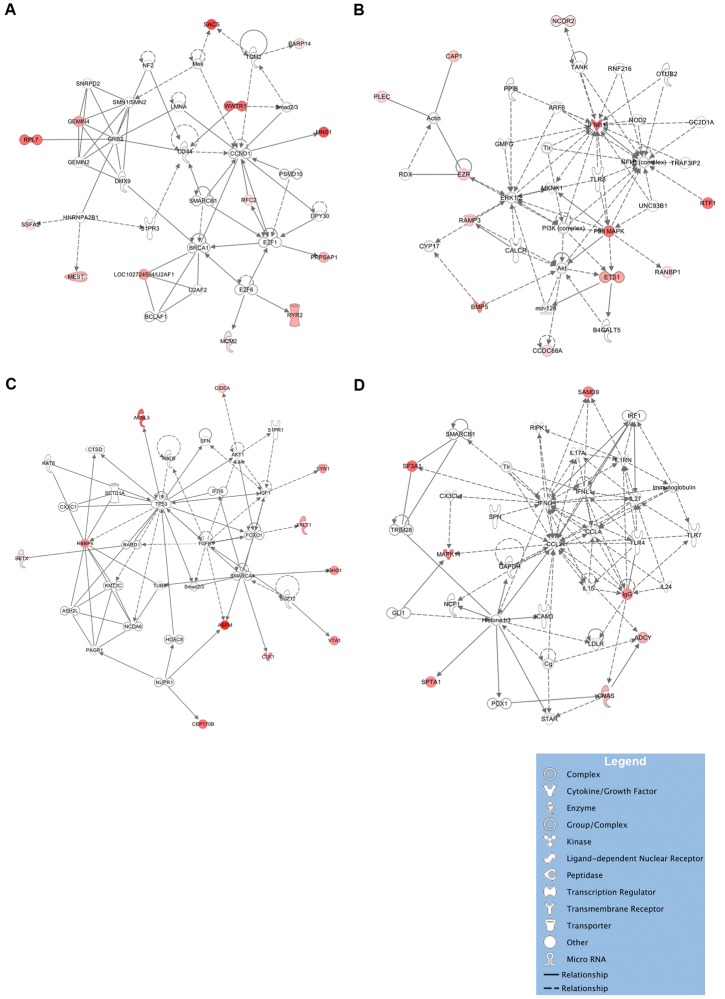
Fig 3. Network analyses of protein clearance markers.
The majority of clearance markers belong to one of four networks. Network A centers on CD44 and CCND1 and consists of genes involved in the cell cycle and RNA post-transcriptional modification (Figure A). Network B centers on IFNβ1, NF-κB, ERK1 and MAPK and includes several additional genes involved in antimicrobial responses, such as TLR8 (Figure B). Network C centers on TP53, and TGF-β and is associated with the cell cycle and with proliferation (Figure C). Network D centers on CCL2, CCL4 and IFN-γ, which are associated with cell activation and migration and which play a central role in tuberculosis (Figure D). Solid lines denote a direct protein-protein interaction, such as binding; dotted lines denote other relationships, such as co-expression, regulation and activation, phosphorylation or cleavage relationships. The intensity of protein expression is denoted in shades of red proportionate to the level of expression.

