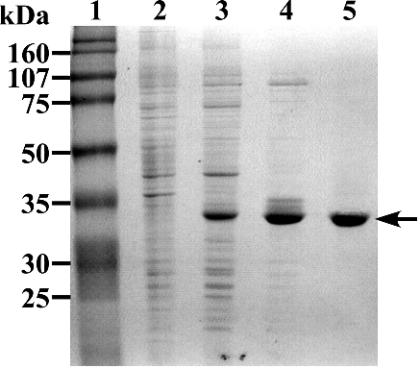
FIG. 3.
SDS-PAGE analysis of protein fractions. Proteins were separated on an SDS-12% polyacrylamide gel and stained with Coomassie brilliant blue. Lanes; 1, molecular size markers; 2, crude extract of E. coli BL21(DE3) harboring pET21a(+) (10 μg of protein); 3, crude extract of E. coli BL21(DE3) harboring pEDZA (10 μg of protein); 4, polyethyleneimine (PI) fraction (5 μg of protein); 5, quaternized PI fraction (3 μg of protein). Molecular masses are given on the left.

