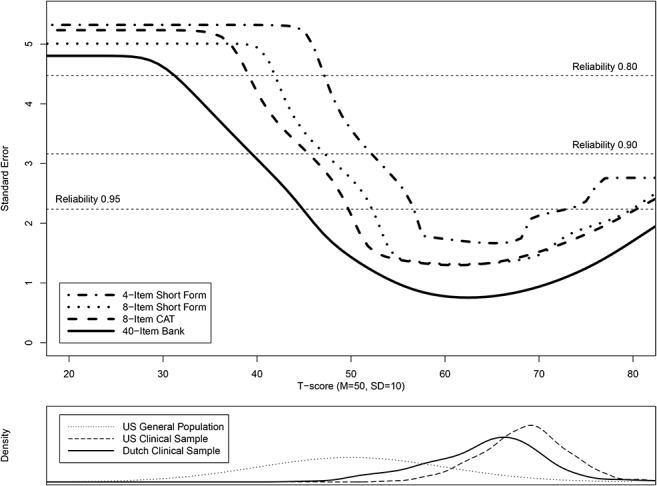
Fig 1. Standard errors across the range of the Dutch-Flemish PROMIS Pain Interference T-scores.

Upper plot shows the standard errors of the Dutch-Flemish PROMIS Pain Interference 4-item short form (v1.0.4a), the 8-item short form (v1.0.8a), the 8-item simulated CAT, and the total item bank. Lower plot shows the distribution of the Dutch AMS-PAIN (Dutch clinical) sample, the US ACPA (US clinical) sample and the US Wave1 sample (US general population) along the T-score scale.
