Figure 4.

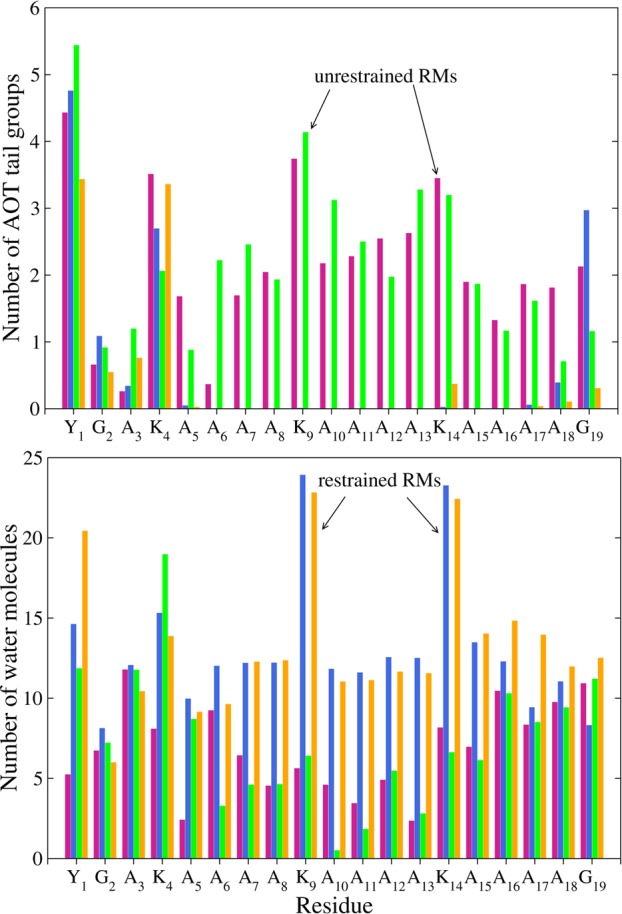
Average number of AOT tail groups (top) and water molecules (bottom) within 4 Å of each AKA2 residue in the CHARMM RMs. Data are shown for capped/zwitterionic peptides in restrained (blue/yellow) and unrestrained (pink/green) RMs.

Average number of AOT tail groups (top) and water molecules (bottom) within 4 Å of each AKA2 residue in the CHARMM RMs. Data are shown for capped/zwitterionic peptides in restrained (blue/yellow) and unrestrained (pink/green) RMs.