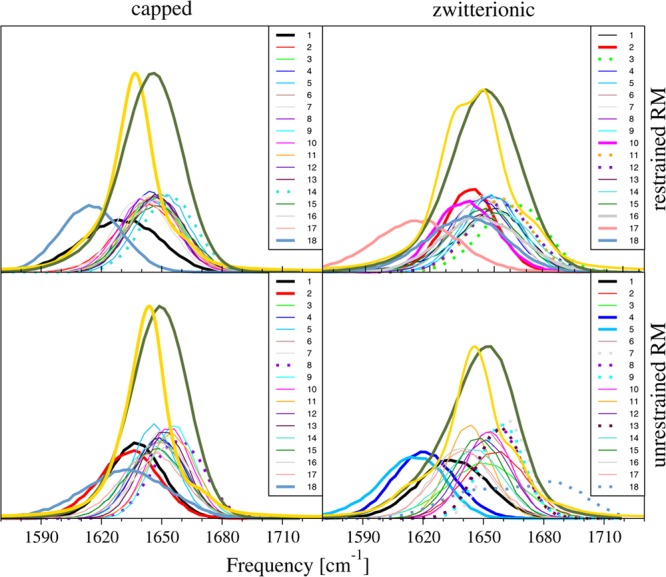
Figure 9.

Comparison of histograms of FFs of each peptide bond (low lying histograms), sum of FFs (green lines), and the calculated spectrum (orange lines) for each studied system. Red-shifted FFs are shown as thin lines, and blue-shifted FFs are shown as dotted lines. FFs were scaled by three for clarity.
