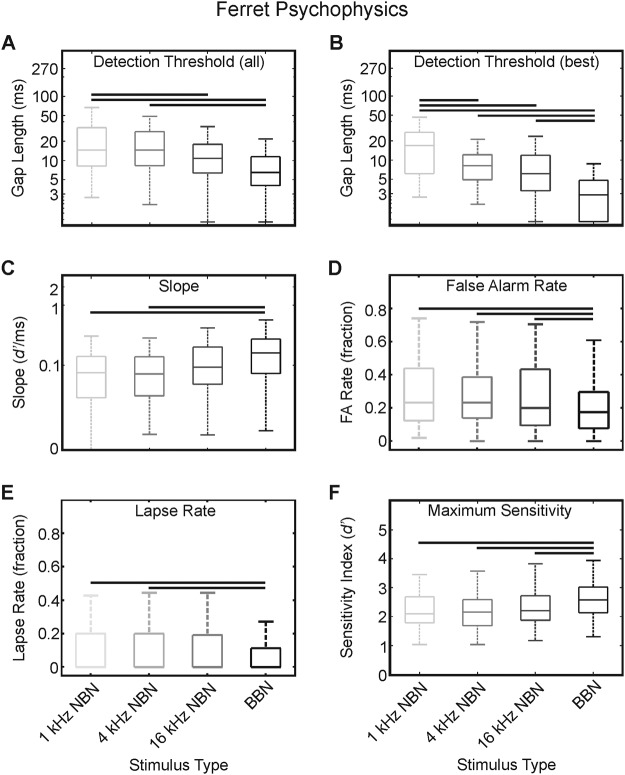
Figure 2.
Ferret behavioral gap-detection results. Gap-detection threshold measured as gap length necessary to achieve a sensitivity of d′ = 1, measured across stimulus types (A). In all figures, data plotted comprise all sessions across all subjects, where box plots indicate medians and interquartile ranges in each condition, with whiskers illustrating maxima and minima. Box outline colors correspond to stimulus frequency: light gray = 1-kHz NBN; midgray = 4-kHz NBN; dark gray = 16-kHz NBN; black = BBN. Horizontal bars indicate significant pairwise post hoc difference at p < .05, corrected for multiple comparisons. Gap-detection thresholds calculated from each animal’s three best sessions (B). Psychometric function slope at threshold (C). False alarm rates, equivalent to proportion of incorrect trials for no-gap stimuli (D). Lapse rates, equivalent to proportion of incorrect trials for stimuli with gap length = 270 ms (E). Maximum sensitivity, measured as d′ at the asymptote of each session’s psychometric function (F).

