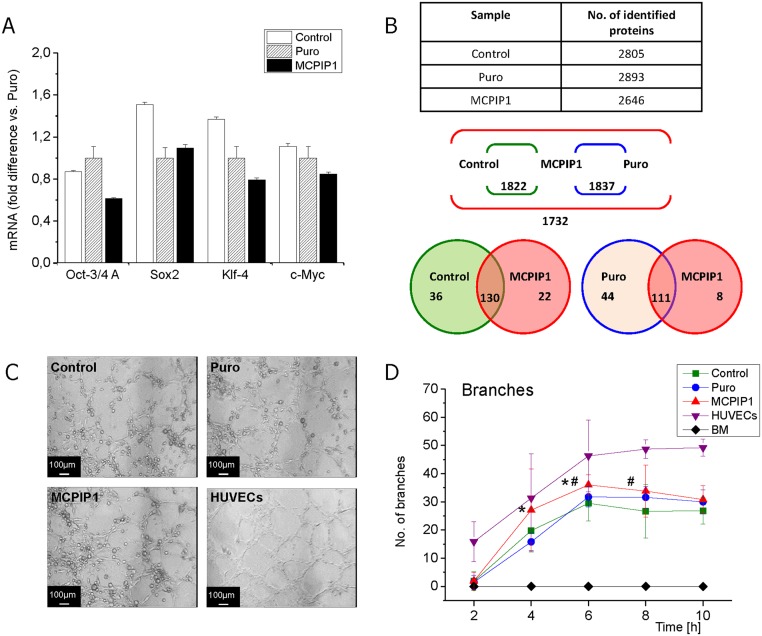
Fig 2. Stem cell-related genes and differentiation capacity of MSCs at 72h post transduction.
(A) Quantitative analysis of mRNA expression for pluripotency related genes by real-time RT-PCR. The graph shows expression of Oct-4, Klf-4, Sox2 and c-Myc in MCPIP1-overexpressing MSCs and control cells (Puro, Control). Fold change in mRNA concentration was computed using the ddCt method when compared with Puro-treated cells (shown as 1). (B) Global proteomic analysis of MSCs at 72h post transduction by mass spectroscopy. Upper panel- Average number of proteins identified in three MSC groups: MCPIP1-overexpressing MSCs, empty vector (Puro)-treated MSCs and untreated (Control) MSCs. Middle panel- Scheme representing total number of common proteins identified in pairs: MCPIP1-overexpressing MSCs vs. Control and MCPIP1-overexpressing MSCs vs. empty vector (Puro)- treated MSCs; and number of common proteins that occur in all analyzed samples. Lower panel- Scheme showing number of proteins identified exclusively in each experimental group as well as common proteins for all compared groups with dNAFs fold change in expression higher than 2.0. (C) The angiogenic potential of MSCs determined by capillary-like tube formation assay. Photos show representative images of capillary- like structures formed on matrigel by MCPIP1- overexpressing MSCs as well as Puro- treated and untreated Control MSCs. Scale bars: 100 μm. (D) Quantitative analysis of angiogenic potential of MSCs overexpressing MCPIP1 when compared with control cells. Graphs represent number of branches at 2, 4, 6, 8 and 10h of capillary formation assay on matrigel. Six randomly selected images of high-power fields for every experimental timepoint were included in quantitative analysis. HUVEC cells were used as positive control, while freshly isolated BM cells represent the negative control. Numbers of branches formed by each cell fraction were computed based on microscopic images as shown in S2B Fig, and the detailed results (Mean number ± SD) are included in S1 Table. All results are presented as mean ± SD. Statistically significant differences (P<0.05) are shown when compared with Puro (*) and Control (#). Analysis based on three independent experiments. Control—untreated MSCs; Puro—empty vector-treated MSCs; MCPIP1- MSCs overexpressing MCPIP1.

