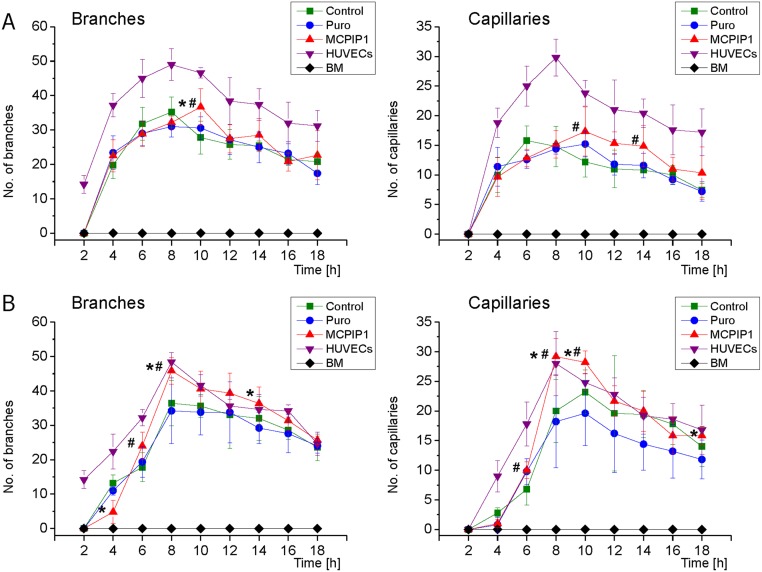
Fig 4. Functional angiogenic potential of MSCs following predifferentiation into endothelial cells by capillary-like formation assay.
(A) Graphs represent quantitative assessment of branches (left graphs) and capillaries (right graphs) formed by MSCs differentiated in proangiogenic medium for 5 days. (B) Graphs show quantitative assessment of branches (left graphs) and capillaries (right graphs) formed by MSCs differentiated in proangiogenic medium for 10 days. HUVEC cells were used as positive control, while freshly isolated BM cells represent the negative control. Six randomly selected high-power field images were selected for quantification. Numbers of branches and capillaries formed by each cell fraction were computed based on microscopic images as shown in S2 Fig and the detailed results are presented in S2 Table. All results are presented as mean ± SD. Statistically significant differences (P<0.05) are shown when compared with Puro (*) and Control (#). Analysis based on three independent experiments. Control—untreated MSCs; Puro—empty vector-treated MSCs; MCPIP1- MSCs overexpressing MCPIP1.

