Figure 2.

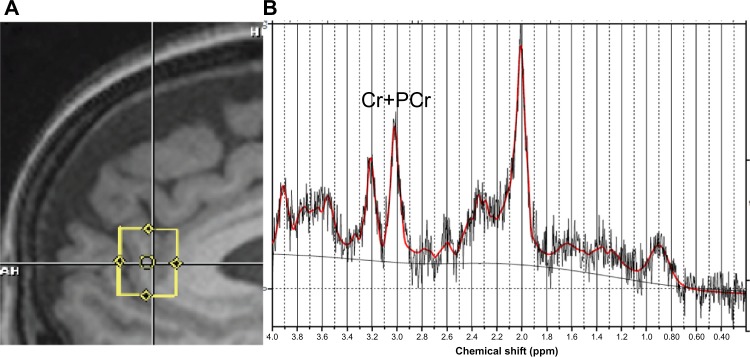
Sagittal MRI of pregenual anterior cingulate and its proton magnetic resonance spectrum.
(A) Sagittal T1-weighted MRI of the human brain showing location of 15×15×15 mm3 proton magnetic resonance spectroscopy (MRS) acquisition voxel (yellow square) in the pregenual anterior cingulate cortex (pACC). (B) Sample raw (jagged gray), baseline (light gray), and fit (solid red) MR spectra acquired from the pACC. The MR spectrum is a plot of the intensity of radiofrequency signal (ordinate axis) vs signal frequency (abscissa) in parts-per-million (ppm). The size (area under the curve) of each peak in the spectrum is proportional to a different biochemical species (metabolite) or small family of chemically related metabolites in the MRS voxel. The peak marked “Cr+PCr” at 3.02 ppm represents the sum of the energetic neurometabolites creatine and phosphocreatine. In our OCD pilot sample, pretreatment Cr+PCr level in pACC was predictive of OCD core and other symptoms at post-treatment follow-up.
Abbreviations: Cr, creatine; OCD, obsessive-compulsive disorder; MR, magnetic resonance; MRI, magnetic resonance imaging; PCr, phosphocreatine.
