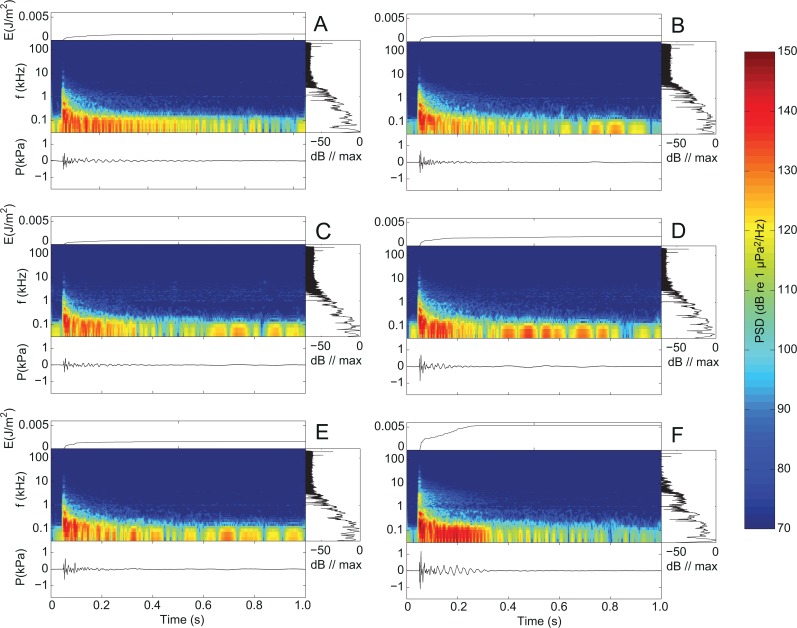
Fig 2. Effect of airgun volume and operating pressure on source characteristics.
Shown are representative recordings obtained 120 m from the airgun at different combinations of volume (from top to bottom: 10 in3, 25 in3 and 40 in3) and operating pressure (left: low; right: high). Each plot contains four subplots with different representations of the signal. Bottom panel: time signal. Center panel: spectrogram (power spectral density, PSD) with logarithmic frequency axis (common color scale across subplots A-F at extreme right). Right panel: normalized power spectral density plotted on the same vertical frequency axis as the spectrogram. Top panel: cumulated sound energy of the pulse from start to end of recording.

