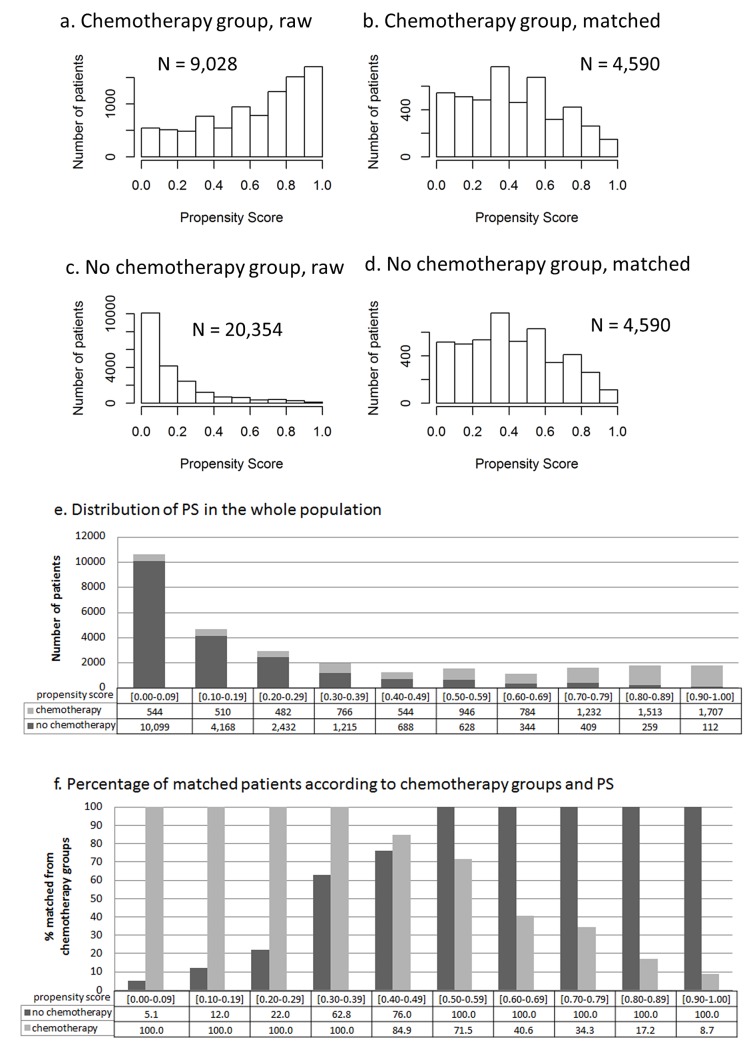
Fig 1. Distribution of propensity scores prior to and after matching.
Mean propensity score (PS) before matching was 0.69 (SD = 0.20) in the chemotherapy-treated group and 0.28 (SD = 0.20) in the non-treated group (p<0.0001). After matching, it was 0.43 (SD = 0.25) in the chemotherapy-treated group and 0.42 (SD = 0.25) in the non-treated group (p = 0.22).

