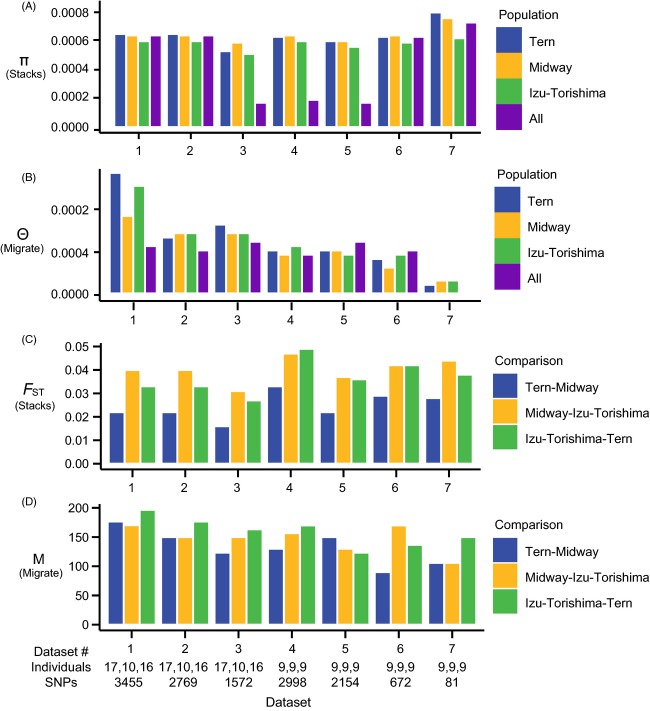
Figure 3.
Estimates of genetic differentiation and gene flow estimated from the seven data sets listed in Tables S2 and S3. π (panel A) and θ (panel B) are reported per base pair. FST (panel C) was calculated in Stacks as described. M (panel D) is the estimate of m/μ in MIGRATE. m/μ is interpreted as the relative number of migration events per mutation across a given data set. When multiplied by the appropriate θ, it can be interpreted as the traditional estimate of gene flow, Nm.

